Servicios Personalizados
Revista
Articulo
Indicadores
-
 Citado por SciELO
Links relacionados
-
 Similares en
SciELO
Compartir
Geoacta
versión On-line ISSN 1852-7744
Geoacta v.33 Ciudad Autónoma de Buenos Aires ene./dic. 2008
ARTÍCULOS ORIGINALES
Examining the plankton acoustic response with a vessel mounted ADCP across oceanic fronts located in the Drake Passage
Silvia Blanc, Michele Baqués and Marta I. Etcheverry de Milou
Naval Service of Research & Development (SENID). Av. Libertador 327. (1638) Vicente López. Pcia. de Buenos Aires. Argentina. FAX 54 (11) 4 795 6895 e- mail:silblanc@yahoo.com
ABSTRACT
On December 2001 and January 2006, during the LMG01-9 and LMG06-1 cruises to Antarctic Peninsula, at-sea oceanographic and acoustic measurements were conducted onboard the R/V L. M. Gould icebreaker along two transects located between (55.15 °S, 65 ºW) and (64.65 °S, 65 ºW) and between (55.15 ºS, 64.91 ºW) and (62.7 ºS, 62.21 ºW), respectively. The scientific crew consisted of researchers from two US institutes, and a scientific observer from the Argentinean Naval Service of Research & Development under the frame of the US National Science Foundation Antarctic Program. The present work accomplishes an alternative application for a vesselmounted Acoustic Doppler Current Profiler (ADCP) with an operating frequency of 153.6 kHz. Volume Acoustic Backscattering Strengths, SV, were computed from the recorded ADCP's voltages. The obtained values fell in a range of -92 dB to -62 dB, for the layer of the water column comprised between 26 m - 300 m on 2001 and in the range of -93 dB to -58 dB for the water column between 22 m - 300 m on 2006. Depth-averaged, SV, for the upper water column (about the first 150 m) on experiment transects were computed as well as SV values averaged in depth and latitude. Data processing revealed interesting features about the upper ocean acoustic behaviour. On December 2001, a significant non-uniform scattering response in the ensonified water column with quite high values of SV, associated with the diel vertical migration, was obtained. Additionally, a remarkable increment in the scattering response was observed at the estimated location of the Antarctic Divergence (AD). This feature was also observed on January 2006 in addition to remarkable high values of SV, in coastal waters of the Antarctic Peninsula. Plotting and exhaustive analyses of SV (z) profiles enabled the visualisation of three distinct types of qualitative patterns, namely, curves with: (I) two observable maxima, (II) only one maximum, (III) a depth-interval of variable width with a minimum acoustic response. Along the experiment transects the obtained results suggest an eventual correlation between the three distinct obtained behaviours of the backscattered acoustic intensity and the oceanic fronts location, leading us to consider the feasibility of using the SV (z) profiles, as an eventual indicator of oceanic fronts and eddies' presence.
Keywords: ADCP; Volume sound scattering; Drake Passage.
RESUMEN
En diciembre de 2001 y enero de 2006 durante los respectivos cruceros LMG01-9 y LMG06-1 a la Península Antártica fueron efectuadas mediciones oceanográficas y acústicas en el mar a bordo del rompehielos R/V L. M. Gould a lo largo de dos trayectos ubicados respectivamente entre (55.15 °S, 65 ºW) y (64.65 °S, 65 ºW) y entre (55.15 ºS, 64.91 ºW) y (62.7 ºS, 62.21 ºW). La tripulación científica consistió en investigadores pertenecientes a dos institutos estadounidenses y una observadora científica del Servicio Naval Argentino de Investigación & Desarrollo, en el marco del Programa Antártico de la Fundación Nacional de Ciencias de los Estados Unidos de Norteamérica. En el presente trabajo se lleva a cabo una aplicación alternativa del Perfilador de Corrientes por Efecto Doppler (ADCP) montado en el buque, con una frecuencia de operación de 153.6 kHz. Fueron calculadas las Fuerzas de Retrodispersión Acústica de Volumen SV, a partir de los voltajes registrados por el ADCP. Los valores resultaron comprendidos en el rango -92 dB y -62 dB, para la columna de agua de mar comprendida entre 26 m y 300 m, en el 2001 y y en el rango -93 dB a -58 dB para la columna de agua entre 22 m y 300 m, en el 2006. Se calcularon promedios en profundidad de SV para la columna superior de agua (aproximadamente los primeros 150 m) sobre los trayectos experimentales, así como valores promedios en profundidad y latitud de SV. El procesamiento de datos reveló características interesantes acerca del comportamiento acústico del estrato superior oceánico. En diciembre de 2001, se obtuvo una respuesta significativa con valores relativamente altos y no uniformes de retro-dispersión acústica SV en la columna de agua sonorizada, asociada a la migración vertical diurna. Asimismo, se observó un llamativo incremento de la respuesta de dispersión en la posición estimada para la Divergencia Antártica. (AD). Este mismo comportamiento fue observado en enero de 2006; asimismo se hallaron valores considerablemente altos de SV en aguas costeras de la Península Antártica. La graficación y el análisis exhaustivo de los perfiles SV (z) permitió a la visualización de tres tipos de diagramas cualitativos diferentes, a saber, curvas con: (I) dos máximos observables; (II) un único máximo; (III) un intervalo de profundidades de espesor variable con una respuesta acústica mínima. A lo largo de los trayectos experimentales, los resultados obtenidos sugieren una aparente correlación entre los tres comportamientos particulares de la intensidad acústica retro-dispersada y la localización de los frentes oceánicos, lo que lleva a considerar la factibilidad de usar los perfiles SV (z) como un eventual indicador de la presencia de frentes y eddies oceánicos.
INTRODUCTION
For nearly four decades scientists have addressed the challenge of using underwater sound measurements to investigate marine organisms' behaviour. In particular, volume sound scattering produced by fish (Batzler and Vent, 1965; Hall, 1971; Love, 1971), zooplankton (e.g., Beamish, 1971; Kinzer, 1970; Greenlaw, 1979; Holliday and Pieper, 1980; Kristensen and Dalen, 1986; Stanton et al., 1998; Stanton and Chu, 1998; not intended to be exhaustive) and, more recently, phytoplankton (Blanc et al., 2000; 2004), have been examined.
Updated techniques of observing and measuring ocean acoustic quantities have been in continuous development for more than three decades. A remarkable illustration of this fact is the quite recent alternative use of the Acoustic Doppler Current Profilers (ADCP) that led to consider this type of current profilers as a cost-effective tool for long-term measurements and nearly continuous monitoring of acoustic quantities' behaviour in the ocean. Although the ADCP was originally designed to determine vector current velocities (Emery and Thompson, 1997), several attempts to estimate biomass, numerical abundance, plankton distribution and migration, through Volume Backscattering Strengths computations, can be found in the literature (Flagg and Smith, 1989; Zhou et al., 1994; RDI, 1998 (a); Deines, 1999; Jiang and Dickey, 2002; Fielding et al., 2004; Lee et al., 2004; Sindlinger et al., 2005; Sutor et al., 2005; Chereskin and Tarling, 2007). More recently, the mean Doppler frequency-shift measurements have been used to interpret movements of zooplankton and fish (Zhou and Dorland, 2004).
On December 2001 and January 2006, scientific personnel from the Argentinean Naval Service of Research and Development took part in the LMG01-9 and LMG06-1 expeditions to Antarctic Peninsula, onboard the R/V Lawrence M. Gould icebreaker, in the role of scientific national observer (Baqués and Blanc, 2004). These expeditions were part of the Antarctic Programme of the US National Science Foundation.
In this paper, partially following a previous work (Flagg and Smith, 1989), the authors made use of the acoustic echo signals that were recorded by a 153.6 kHz vessel-mounted ADCP to examine the volume sound scattering mainly originated in zooplankton aggregations across the Drake Passage, between (55.15 °S, 65 ºW) and (64.65 °S, 65 ºW) in the nearly austral summer, on 2001; and between (55.15 ºS, 64.91 ºW) and (62.7 ºS, 62.21 ºW), in the austral summer on 2006.
The main objective of this study was to explore relationships between the features of the ADCP Volume Backscattering Strength recordings, associated with the distribution of scatterers of biological origin, and the presence of different oceanographic features like frontal areas and eddies, along two transects of measurements of about 1000 km each, made on 2001 and 2006, in the Drake Passage.
THEORETICAL FOUNDATIONS
Volume Backscattering Strength, measured in dB, is a parameter often used in underwater sound to account for the ability of a medium to scatter acoustic waves in the direction back towards the source, producing the consequent echo. It is defined as the ratio between the scattered intensity at 1 m distance from a unit volume containing volume scatterers, Is; and the incident plane wave-intensity on the volume, Iinc, expressed in logarithmic units. That is

SV is dependent on the type and numerical abundance of scatterers within the unit volume, which give rise to the respective echoes. From a practical viewpoint, Is and Iinc, cannot be directly measured. However, their ratio can be experimentally determined (Urick, 1975) from other observable quantities, namely, the acoustic intensity of the echo signal at the transducer receiver terminals, Iecho, and the ransducer source output axial acoustic intensity, Io, in addition to some external parameters, non-dependent on the volume scatterer nature, but related to either the oceanic environmental conditions (such as the sound velocity in the ocean, c) or the particular experimental configuration (such as the transmitted pulse length , t; the transducer-scattering volume distance, r; angle of beam axis regarding vertical direction, θ). Schematic visualisation of this fact is illustrated in Figure 1.
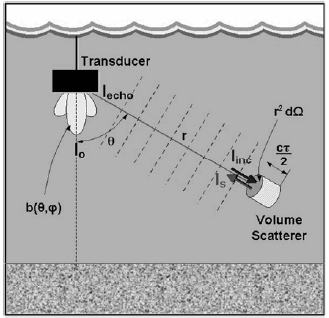
Figure 1. Schematic illustration of SV computation. (Symbols: dΩ, differential solid angle, with vertex at the transducer, subtended by the differential area of the volume containing scatterers and b(θ, ϕ), the beam pattern of the transducer projector-hydrophone system).
In particular, when an acoustic current profiler (ADCP) ensonifies a water-column, its emitted signals are scattered by suspended matter (e.g. plankton, bubbles and sediment particles), by the seabed or by the sea surface, as schematically shown in Figure 2. The correspondent echo intensities, Iecho, at the hydrophone terminals of the ADCP are the result of a complex combination of different processes, namely, the power that was transmitted into the water (or its equivalent quantity Io), the acoustic configuration of the ADCP transducer, its directivity, attenuation effects due to geometrical spreading, chemical absorption and the volume scattering of sound itself.
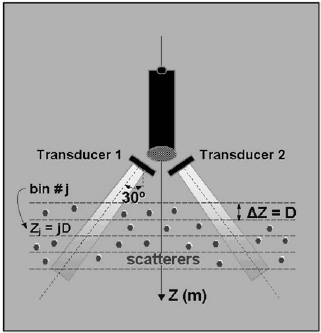
Figure 2. Scheme of acoustic scattering by volume scatterers within the water column ensonified by an ADCP.
In RDI documentation (RDI, 1998 (a)) the following equation is derived for SV (in dB)

where, the echo intensity E, in counts, takes account for the above mentioned Iecho(watt/m2) since Kc is the conversion factor for echo intensity (dB/counts); while K1, the real-time power into the water, measured in watts, takes account for Io. The other parameters that appear in Eq. (2) are: the real-time reference level for echo intensity (in counts), Er; the system noise factor (dimensionless), K2; the system constant whose value depends on the ADCP frequency, KS ; the real-time temperature of the ADCP transducer (in ºC), TX ; the transmit pulse length (in m), P; the sound speed at each depth cell (in m/s), c; and the sound absorption coefficient in (dB/m), α. The slant range to a given depth-bin, or the equivalent depth-layer scatterer (RDI, 1998 (a)), is given by

where the index j is related to depth, z, by z=jD, with j = 1, 2,…N; D is the depth cell thickness (m); B is the blank after the transmitted pulse (m); and θ is the angle of the transducer beam axis from vertical.
DATA FROM FIELD MEASUREMENTS
Access to at-sea data, collected as part of a long-term measurements programme during the LMG01-9 and the LMG06-1 cruises (by courtesy of Dr T. K. Chereskin, Principal Investigator in charge of ADCP measurements), enabled the study of the acoustic response of volume scatterers, here reported, upon the basis of data processing of the voltages recorded with the vessel mounted ADCP, corresponding to backscattered acoustic signals.
The performed analysis and data processing were restricted to measurements held with the ADCP operating at 153.6 kHz, that took place from 4 to 7 December, 2001 (called Event I from now onwards) and from 2 to 4 January, 2006 (Event II). Figure 3 shows the experiment transects which were part of broader oceanographic measurements areas in both cases.
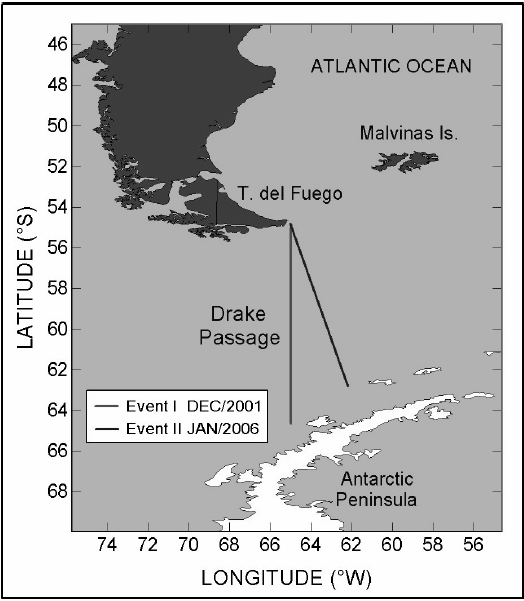
Figure. 3. Experiment transects.
Authors had also access to necessary oceanographic measurements as far as they act as input data for further computation of the acoustic parameters under examination in this work.
Bathymetry sections of the experiment transects are shown in Figure 4 (a) and (b). Bottom depth measurements were obtained with a hull-mounted Knudsen 320 BR deep water echosounder operating at 3.5 kHz. In-situ temperature data collection was part of a high resolution XBT program initiated on September 1996 (Sprintall, 2003). Along the experiment transect, 82 XBT probes were dropped during Event I to provide an adequate coverage of the upper ocean circulation within the Drake Passage. From the total resulting XBT profiles, 74 were selected from Event I. Analogously, 67 XBT profiles were selected from Event II for this study. Figure 5 (a) (courtesy of Dr T. K. Chereskin) and (b) show the obtained temperature distribution for the first 418 m of the seawater column through a contour lines plotting in the depth-latitude plane. Expendable conductivity-temperature-depth probes (XCTD) were used for salinity measurements.
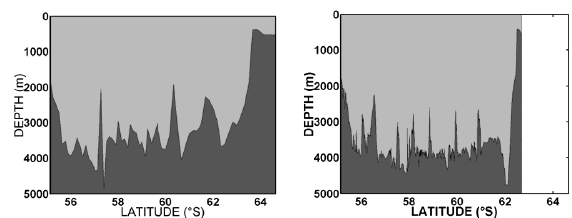
Figure 4. Bathymetry profiles along the experiment transects: (a) Event I; (b) Event II.
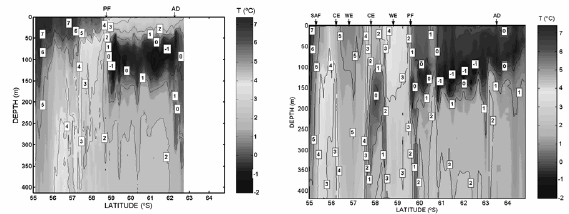
Figure 5. Temperature (ºC) vs. depth (m) and latitude (ºS). Contour lines in the first 418 m of the seawater column: (a) Event I. (Courtesy Dr T. K. Chereskin); (b) Event II.
A narrow band vessel mounted ADCP, manufactured by RD Instruments Inc. for oceanographic surveys, operating at 153.6 kHz, continuously ensonified the dynamic seawater column below it. It essentially consisted of four ceramic transducers, each of them pointing downwards 30° off the geometric vertical axis of the whole device. Its setting enabled the recording of acoustic echo-signals coming from the 26 m - 418 m and the 22 m - 406 m depth-intervals during Events I and II, respectively, corresponding to layers or depth bins, with a depth-thickness (D) of 8 m each. Signals were recorded at 300 s sampling intervals. The seawater columns were ensonified with pulses with a length (P) of 16 m and 8 m during Events I and II, respectively, followed by a blank (B) of 8 m after each transmitted pulse in both events.
This type of current meters has traditionally been used to determine oceanic vector current velocities from recorded Doppler frequency shifts. Here, attention was focused in the voltages recorded with the Automatic Gain Control adjustment. A Data Acquisition Software (DAS), provided by RD Instruments, was used to record the electrical voltages corresponding to the acoustic echo signals. The respective raw binary data were contained in PINGDATA files. At-lab visualisation was made, for measurements from Event I, using the LISTDAS.exe v. 2.0 software (RDI, 1998 b, courtesy of H. A. Thomas, Sr., Lead Field Service Engineer, Customer Service Group). Conversion to ASCII data was carried out with the LOGDAS.exe v. 2.0 software also provided by RD Instruments (RDI, 1998 c). Another web available software from RD Instruments, namely, WinADCP version 1.13, was used, for measurements from Event II.
Eq. (2) was used to compute SV, for each of the 50 depth-bins along the nearly vertical direction. The measurable quantity E (in counts) accounts for the average recorded echo signals.
Since the sound source output intensity at 1 m along the acoustic axis for each of the four component transducers of the ADCP, Io, was not available, no variation in the real-time power into the water could be taken into account. The factory calibration value, K1c, was tentatively assumed for K1 (K1=K1c= 3.3 watts), as it has already been done by some investigators in the Antarctic Peninsula region during austral winter using a 153 kHz vessel mounted ADCP (Zhou et al., 1994). The assumed absorption coefficient value for 153.6 kHz was 0.044 dB/m (Urick, 1975). The values of the constants K2, KS and Kc in Eq. (2) were the ones provided by RD Instruments, namely, K2 = 4.3, KS = 4.17 x10⁵ and Kc=0.45 dB/counts. Experimental values for TX were obtained from at-sea ADCP recorded data for each positions where the selected XBTs were dropped. Regarding to Er, an accurate analysis of how do the lowest value of E, recorded for the water column at each of the different positions, affects SV computation in Eq. (2), led to the assumption of an average value, namely, Er = 9.9 counts and Er = 6 counts for Events I and II, respectively. The slant range, in Eq. (3), was calculated with θ = 30º, for each depth-bin.
RESULTS AND DISCUSSION
A well known empirical formula (Medwin and Clay, 1998) was used to compute the sound velocity profiles from bathythermographic and salinity measurements for the first 418 m of the seawater column along the experiment transects (Fig. 6 (a) and (b)).
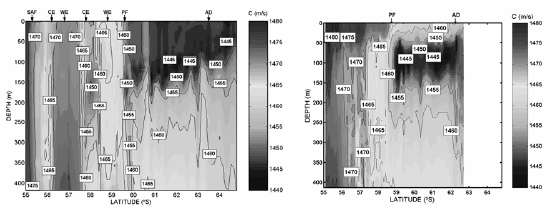
Figure 6. Computed sound velocity (m/s) vs. depth (m) and latitude (ºS). Contour lines in the first 418 m of the seawater column: (a) Event I; (b) Event II.
Eq. (2) was used to compute SV as a function of depth, z, through the slant range, r = r(z), as set in Eq. (3). Temperature measurements, as well as computed sound velocities, were used as input data in Eqs. (2) and (3) to calculate SV. Figure 7 (a) and (b) show contour lines plots of SV (dB) vs. depth (m) and latitude (ºS), restricted to the seawater column for which reliable scattering data could be computed, namely, between 26 m and 300 m, and between 22 m and 300 m, for Events I and II, respectively. Although the ADCP continuously recorded echo signals along the experiment transects, results presented in Figure 7 only show the interpolated SV (z) profiles corresponding to the locations of the selected XBT measurements. According to the obtained results, a variability of about 30 dB and 35 dB, for Events I and II, respectively, was detected across the Drake Passage corresponding to a SV range of -92 dB to -62 dB (Event I) and to a SV range of -93 dB to -58 dB (Event II).
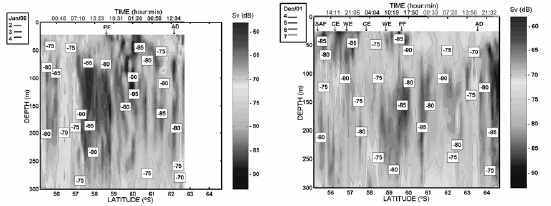
Figure 7. Computed Volume Backscattering Strengths (dB) vs. depth (m) and latitude (ºS). Contour lines in the: (a) 26 m - 300 m (Event I) and (b) 22 m - 300 m (Event II), depth-interval of the seawater column. Different colours at the top axis are used to indicate measurements' date and time.
Figure 8 shows, for Event I, the superposition of the bathymetry of the experiment transect with the results presented in Figure 7 (a), in order to show the limited portion of the water column from where the acoustical response of the ensonified plankton was analysed.
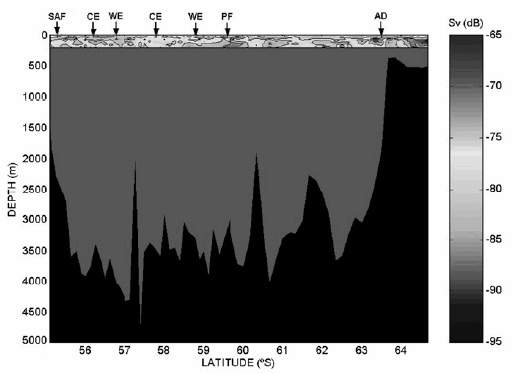
Figure 8. Superposition of the bathymetry with the computed Volume Backscattering Strengths (dB) vs. depth (m) and latitude (ºS) for Event I.
An upper zone with a non-uniform thickness, characterised by a relative high volume scattering response, can be observed in Figure 7 (a). Its behaviour changes with distance. For the latitudes comprised between the Subantarctic (SAF) and the Polar Fronts (PF) locations, at 55.30 ºS and 59.60 ºS, respectively (Sprintall, 2003), within the Convergence Zone (CZ), it can be observed a noncontinuous shallow water zone of relative peaks of volume backscattering whose mean depth tends to decrease with latitude from about 125 m to 75 m. Taking into account the time of the day, these features could be associated with the diel vertical migration (DVM) of zooplankton, which descends to greater depths escaping predation during daylight and ascends looking for food at night. Additionally, an increment in SV values between 200 and 300 m could be observed during night time. This pattern could correspond to the night time ascension of deeper scattering layers.
For higher latitudes, between the Polar Front (PF) location and the Antarctic Divergence Zone (AD), located at approximately 63.5 ºS (Sprintall, 2003), a quite continuous shallow water layer of relative peaks of volume backscattering strength appears at a mean depth of approximately 50 m. A trend towards a significant decrement in the thickness of this layer is evident as latitude increases, between the AD and nearly the end of the experiment transect (64.65 ºS ), where SV values drop below -80 dB. DVM could not be observed in this section of the experiment transect.
In addition to the above general mentioned features, a remarkable local increment of volume backscattering strength levels can also be observed in Figure 7 (a), between 60 m and 120 m, near the AD location (≈ 63.5 ºS). This fact is compatible with the associated organic productivity and the consequent increment in nutrients concentration that characterises the upwelling waters at the AD, turning it so attractive to zooplanktonic organisms that act as sound volume backscatterers at 153.6 kHz.
Regarding Figure 7 (b), an upper zone of almost 50 m width can be observed between 55.15 ºS and the PF (approximately located at 58.6 ºS), characterised by a relative high volume scattering response. Moreover, between 56.2 ºS and 57.3 ºS, high values of Sv can be observed in the overall water column. This could be correlated with the nigth-time ascending of the surface and deeper scattering layers looking for food. Values of SV higher than -75 dB were observed over the whole transect between 250 m and 300 m, except for the zone comprised between 57.3 ºS and 58.9 ºS, where values of SV below - 80 dB were obtained for the water column. A local increment in the volume scattering response arises in surface waters at 61.8 ºS, up to 100 m, near the AD, whose location was estimated at 62.1 ºS. This feature was also observed during Event I. Additionally, remarkable high values of SV (up to -60 dB) could be observed in surface waters of the coastal region between the AD and the Antarctic Peninsula. As it is well known, the sound volume backscattering is a physical phenomenon that provides an excellent mechanism to acoustically examine the abundance and distribution of organisms present in the ocean, whose size dimensions are greater or equal than the acoustic wavelength, since they produce a strong acoustic response (echo) when they are ensonified. Whenever SV determinations and biological sampling analysis are simultaneously performed, considerable insight into this coupled biologic-physical process can be obtained. Unfortunately, in this study non systematic biological sampling was available in conjunction with the ADCP recordings along the experiment transect. Thus, the backscattered signals could not be correlated to the type and abundance of the organisms present in the volume of water analysed.
Figure 9 (a) and (b) show depth-averaged, <Sv> versus latitude, for the upper water column on transects made during Event I (up to 154 m) and Event II (up to 150 m), respectively, in order to analyse the diel vertical migration of the upper scatterers excluding the contribution of deeper scatterers which ascend at night. Values of SVa averaged in depth and latitude, were computed. The obtained value on December 2001, -76.87dB, is lower than the obtained one on January 2006, -75.63 dB. This feature was also found for the 1999-2004 years by Chereskin, 2007. In Figure 9 (a) a weak dependence of <Sv> with latitude is observed except for the fact that there are two depressions of about 5 dB centred near 56.9 ºS and 59.4 ºS. This could be correlated with diel vertical migration (in agreement with Chereskin, 2007, for southbound data from December 2001). In addition, there is a remarkable local increment of 6.4 dB at 63.3 ºS near the location of the AD. A quite significant depression of almost 7 dB is observed in the overall water column between the AD and the Antarctic Peninsula. On the other hand, Figure 9 (b) shows a broad latitude-range depression, centred at approximately 59.4 ºS. Regarding the expected ascending night-time and descending day-time layers, the <Sv> showed no significant dependence except near 56.5 ºS where there is an increment in <Sv> values in the whole water column, up to -71.3 dB, in coincidence with the night-time ascending of the surface scattering layer. The high <Sv> values observed between 62.3 ºS and 62.5 ºS could be associated to the presence of the AD and to the fact that this portion of the transect lies on the Antarctica shelf corresponding to shallower waters.
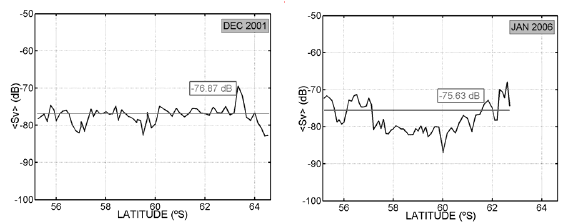
Figure 9. Averaged < SV > along the water column depth-layer between: (a) 26 m and 154 m, on transect made during Event I. Latitude-averaged SV a=-76.87 dB; (b) 22 m and 150 m, on transect made during Event II. Latitude-averaged SV a=-75.63 dB.
Besides the over-all given description of the obtained results, a detailed examination of each of the curves corresponding to the computed SV (z) profiles gave rise to some interesting features. In an attempt to obtain a profound insight into how the volume backscattering behaviour might be correlated to oceanographic characteristics, results visualised along the north-south bound acoustically investigated during Event I were summarised into three distinct types of qualitative patterns. As shown in Figure 10, profiles with: (I) two observable maxima, (II) only one maximum, (III) a distinct depthinterval of variable width with minimum acoustic response, can be distinguished. Moreover, when comparing the latitude that corresponds to each computed SV (z) profile, it was found that most of the curves exhibiting a pattern like the so-called Types II and III, respectively belonged to latitudes comprised between the PF and the AD and to latitudes between the AD and the Antarctic continent. However, gradual, non-sharp transitions occur from one type of pattern to the other, with non accurate limits between the above mentioned regions. Regarding the profiles that correspond to the CZ, between the SAF and PF, somewhat higher complexity and non uniform behaviour is observed, though a significant number of profiles exhibiting a pattern of the first type with two relative maxima were obtained. This observation can be partially understood under the frame of the quite complex oceanographic features found in the CZ, where the presence of two cold eddies and two warm ones could be identified (Sprintall, 2003). An equivalent analysis of the computed SV(z) profiles from Event II led to analogous results.
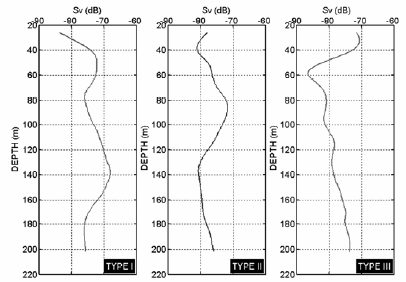
Figure 10. Illustrative examples of the three distinct qualitative patterns obtained during Event I Types: I: 55.90 ºS; II: 60.00 ºS and III: 64.15 ºS, obtained for, Sv(z) profiles.
In fact, since oceanic fronts lay aside different water masses with their different respective physical properties, it seems reasonable to suspect distinct features among the marine organisms that play the role of volume scatterers responsible of the acoustic signals, at the operating frequency.
CONCLUSIONS
The participation of one the authors in the LMG01-9 and LMG06-01 cruises, provided the opportunity to analyse the acoustic response of volume scatterers, as recorded by an ADCP, analysis originally out of the scope of the expedition. The reported field values of SV were computed under the assumption of the validity of the original factory calibration values. This led to a first insight into the sound volume backscattering behaviour at the temporal and spatial conditions of the at-sea measurements. However, bearing in mind that the lack of in-situ calibration procedures for the used ADCP plays a significant role against the reliability of SV values here reported, a critical issue to be taken into account in further measurements is the fact that calibration during the expedition will be needed to enable comparisons of results obtained with different ADCP equipment.
Undoubtedly, simultaneous biological sampling and ADCP echo signals recordings will be essential in further field measurements in order to have definitive experimental foundations for further interpretation of the obtained volume backscattering responses.
The results of this study, while somewhat preliminary, are essentially quite encouraging. In particular, the apparent correlation between a distinct behaviour of the backscattered acoustic intensities and oceanic fronts location along the experiment transect, justifies further efforts to analyse the feasibility of considering the behaviour of SV (z) profiles as an in-situ indicator of the presence of oceanic fronts and other oceanographic features. This eventual correlation is suggested independently from other well known features of zooplankton organisms behaviour, such as their diel vertical migration that might affect their scattering response.
Acknowledgements: The authors acknowledge the Office of Polar Programs of the US National Science Foundation and the Argentinean Antarctic Institute for enabling the participation of Ms M. Baqués, in this expedition. They are deeply grateful to Dr Teresa K. Chereskin with Scripps Institute of Oceanography, in charge of ADCPs measurements who released the acoustic data; and to Dr Jack Stamates, with the Chemical Oceanography Division of Atlantic Oceanographic and Meteorological Laboratory-NOAA, for having provided appropriate references.
REFERENCES
1. Baqués, M. and S. Blanc, 2004. Oceanographic and acoustic measurements in Drake Passage. GAYANA, International Journal of Biodiversity, Oceanology and Conservation 68(2) I: 22-29. [ Links ]
2. Batzler, W. E. and R. E. Vent, 1965. Volume scattering measurements at 12 kHz in the Western Pacific. Journal of the Acoustical Society of America 38, 932. [ Links ]
3. Beamish, P., 1971. Quantitative measurements of acoustic scattering from zooplanktonic organisms. Deep Sea Research, 18: 811-822. [ Links ]
4. Blanc, S., C. E. Benítez, M. I. E. de Milou, P. Mosto, G. Lascalea and R. E. Juárez, 2000. Acoustical behaviour of phytoplanktonic algae. Acoustics Letters 23 (9): 175-183. [ Links ]
5. Blanc, S., P. Mosto, M. I. E. de Milou and C. E. Benítez, 2004. An alternative proposal: acoustic techniques to asses detection and monitoring of toxic algal blooms. GAYANA, International Journal of Biodiversity, Oceanology and Conservation 68 (2) I: 54- 60. [ Links ]
6. Chereskin, T. K. and G. A. Tarling, 2007. Interannual to diurnal variability in the near-surface scattering layer in Drake Passage. ICES Journal of Marine Science 64: 1617-1626. [ Links ]
7. Deines, K. L., 1999. Backscatter estimation using Broadband Acoustic Doppler Current Profilers. Proceedings of 6th IEEE Working Conference on Current Measurement, S. Diego, USA. [ Links ]
8. Emery, W. J. and R. E. Thomson, 1997. Data Analysis Methods in Physics. Ocean, 2nd and revised edition, Elsevier, The Netherlands, 83-94. [ Links ]
9. Fielding, S., G. Griffiths, and H. S. J. Roe, 2004. The biological validation of ADCP acoustic backscatter through direct comparison with net samples and model predictions based on acoustic-scattering models. Journal of Marine Sciences 61( 2): 184-200. [ Links ]
10. Flagg, Ch. N. and Sh. L. Smith, 1989. On the use of acoustic Doppler current profiler to measure zooplankton abundance. Deep-Sea Research 36(3): 455-474. [ Links ]
11. Greenlaw, Ch. F.,1979. Acoustical Estimation of zooplankton populations. Limnology and Oceanography 24 (2): 226-242. [ Links ]
12. Hall, M., 1971. Volume backscattering in the south china sea and the Indian ocean. Journal of the Acoustical Society of America 50 (3): 940-945. [ Links ]
13. Holliday, D. V. and R. E. Pieper 1980. Volume scattering strengths and zooplankton distributions at acoustic frequencies between 0.5 and 3 MHz. J. of the Acoust. Soc. of Am. 67 (1): 135-146. [ Links ]
14. Jiang, S. and T. Dickey, 2002. Estimation of zooplankton biomass temporal variability from ADCP backscatter time series data at the Bermuda Testbed Mooring Site. American Geophysical Union, Fall Meeting 2002, abstract #OS71C-0303. [ Links ]
15. Kinzer, J., 1970. On the contribution of euphausiids and other plankton organisms to Deep Scattering Layers in the Eastern North Atlantic. In: Proceedings of an International Symposium on Biological Sound Scattering in the ocean. Brooke Farquhar, G. (Ed.). MC Rep. 005, US Naval Oceanographic Office, 476-489. [ Links ]
16. Kristensen, A. and J. Dalen, 1986. Acoustic estimation of size distribution and abundance of zooplankton. J. of the Acoust. Soc. of Am., 80 (2): 601-611. [ Links ]
17. Lee, K., T. Mukai, D. Kang, and K. Iida, 2004. Application of acoustic Doppler current profiler combined with a scientific echo sounder for krill Euphausia pacifica density estimation. Fisheries Science, 70(6): 1051-1060. [ Links ]
18. Love, R. H., 1971. Dorsal-Aspect Target Strength of individual fish. J. of the Acoust. Soc. of Am., 49 (3) 2: 816- 823. [ Links ]
19. Medwin, H. and C. S. Clay, 1998. Fundamentals of Acoustical Oceanography. Academic Press, USA, 712 pp. [ Links ]
20. RD Instruments, 1998 (a). Calculating Absolute Backscatter in Narrowband ADCPs. Technical Report. Field Service Technical Paper 003, 24 pp. [ Links ]
21. RD Instruments, 1998 (b). User's guide for the RD Instruments. Quick-Look Data Processing Program LISTADCP.EXE. Version 2.00. Technical Report. [ Links ]
22. RD Instruments, 1998 (c). User's Manual. Program LOGDAS.EXE - Vers. 2.00. Technical Report. [ Links ]
23. Sindlinger, L. R., D. C. Biggs and S. F. Dimarco, 2005. Temporal and spatial variability of ADCP backscatter on a continental slope. Continental Shelf Research, 25 (2): 259-275. [ Links ]
24. Sprintall, J., 2003. Seasonal to interannual upper ocean variability in the Drake Passage. J. of Marine Res. 61: 27-57. [ Links ]
25. Stanton, T. K., D. Chu, P. Wiebe, L. V. Martin, and R. Eastwood, 1998. Sound scattering by several zooplankton groups. I. Experimental determination of dominant scattering mechanisms. J. of the Acoust. Soc. of Am. 103 (1): 225-235. [ Links ]
26. Stanton, T. K. and D. Chu, 1998. Sound scattering by several zooplankton groups. II. Scattering models. J. of the Acoust. Soc. of Am. 103 (1): 236-253. [ Links ]
27. Sutor, M. M., T. J. Cowles, W. T. Peterson and S. D. Pierce, 2005. Acoustic observations of fine scale zooplankton distributions in the Oregon upwelling region. Deep-Sea Research II 52: 109-121. [ Links ]
28. Urick, R., 1975. Principles of underwater sound for engineers. McGraw Hill, 2nd ed., New York, 384 pp. [ Links ]
29. Zhou, M., W. Nordhausen and M. Huntley, 1994. ADCP measurements of the distribution and abundance of euphausids near the Antarctic Peninsula in winter. Deep-Sea Research I 41(9): 1425-1445. [ Links ]
30. Zhou, M. and R. D. Dorland, 2004. Aggregation and vertical migration behaviour of Euphausia superba. Deep- Sea Research II 51: 2119-2137. [ Links ]


