Servicios Personalizados
Revista
Articulo
Indicadores
-
 Citado por SciELO
Links relacionados
-
 Similares en
SciELO
Compartir
Revista de la Facultad de Ciencias Agrarias. Universidad Nacional de Cuyo
versión On-line ISSN 1853-8665
Rev. Fac. Cienc. Agrar., Univ. Nac. Cuyo vol.45 no.2 Mendoza dic. 2013
ARTÍCULOS ORIGINALES
Genetic diversity among alfalfa genotypes (Medicago sativa L.) of non-dormant cultivars using SSR markers and agronomic traits
Análisis de la diversidad genética en genotipos de alfalfa (Medicago sativa L.) sin dormición, mediante el uso de marcadores SSR y caracteres agronómicos
Nancy G. Grandón 1, Yanina Alarcón 2, María V. Moreno 1, Valeria Arolfo 3, Ariel Orodizzi 3, Daniel H. Basigalup 3, Jorge O. Gieco 1, Cecilia Bruno 4
1 Biotecnología en Cultivos. INTA–EEA Manfredi. Ruta Nac. N° 9, Km 636. (5988) Manfredi. Córdoba, Argentina. nggrandon@manfredi.inta.gov.ar
2 Institute of Plant Breeding, Genetics and Genomics. University of Georgia. UGA. Athens, Georgia, USA.
3 Mejoramiento genético de alfalfa. INTA-EEA Manfredi.
4 Cátedra de Estadística y Biometría. Facultad de Ciencias Agropecuarias. Universidad Nacional de Córdoba. Av. Valparaíso s/n. (5000) Ciudad Universitaria, Córdoba, Argentina
Originales: Recepción: 21/08/2012 - Aceptación: 26/08/2013
Abstract
The aim of this study was to assess genetic diversity among 40 alfalfa (Medicago sativa L.) genotypes of different non-dormant (FD=8) cultivars. Biomass yield, regrowth speed and reaction to spring black stem, lepto leaf spot, and rust were evaluated. Analyses of variances were performed using a mixed model to examine the agronomic variation among individuals. A principal component analysis on standardized agronomic data was performed. Agronomic data were also used to calculate Gower's distance and UPGMA algorithm. For the molecular analysis, six SSR markers were evaluated and 84 alleles were identified. The genetic distance was estimated using standard Nei's distance. Average standard genetic diversity was 0.843, indicating a high degree of variability among genotypes. Finally, a generalized procrustes analysis was performed to calculate the correlation between molecular and agronomic distance, indicating a 65.4% of consensus. This value is likely related to the low number of individuals included in the study, which might have underestimated the real phenotypic variability among genotypes. Despite the low number of individuals and SSR markers analyzed, this study provides a baseline for future diversity studies to identify genetically distant alfalfa individuals or cultivars.
Keywords: Autotetraploid; Microsatellite markers; Cluster analysis; Principal components analysis; Generalized procrustes analysis; Plant breeding
Resumen
El objetivo de este trabajo consistió en determinar la diversidad genética en 40 individuos de alfalfa (Medicago sativa L.) de cinco cultivares de grado de reposo 8. Se evaluaron a campo la producción de forraje, la velocidad de rebrote y el comportamiento frente a tallo negro de primavera, mancha ocular y roya. El análisis de la varianza se realizó mediante un modelo lineal mixto para determinar la variación agronómica entre los individuos. El análisis de componentes principales se realizó a partir de los datos agronómicos estandarizados. El dendrograma agronómico se construyó a partir del índice de Gower y el agrupamiento UPGMA. Para la caracterización molecular se analizaron seis marcadores SSR, con los cuales se identificaron un total de 84 alelos. Las distancias genéticas se calcularon con el índice de Nei estándar. La diversidad genética promedio fue de 0,843, indicando una alta variabilidad entre los individuos evaluados. Por último, el análisis de procrustes generalizado detectó un 65,4% de consenso entre el ordenamiento agronómico y el molecular. Este porcentaje probablemente se relacione con el bajo número de individuos y marcadores SSR analizados; sin embargo, este estudio provee una línea de base para estudios futuros de diversidad que permitirán identificar individuos o cultivares genéticamente distantes.
Palabras clave: Autotetraploide; Marcadores microsatélites; Análisis de clusters; Análisis de componentes principales; Análisis de procrustes generalizado; Mejoramiento vegeta
Introduction
Alfalfa (Medicago sativa L.) is the most important forage crop worldwide. In Argentina, a 4.5 million-ha area is cultivated, with 90% concentrated in Buenos Aires, Córdoba, Santa Fe, La Pampa and Entre Ríos (5). Alfalfa belongs to the Fabaceae family; it is a perennial, autotetraploid (2n = 4x = 32) and highly heterozygous species. Cultivars are synthetic populations obtained after three or four generations of open pollination from a number of parents. Its importance as a forage crop lies in its high protein, vitamin and mineral contents, as well as its nitrogen-fixing performance through Sinorhizobium meliloti symbiosis (6).
Molecular characterization of germplasm provides useful data for parental selection in breeding populations. Such populations are established by crossing genetically distinct superior genotypes to obtain favorable gene combinations (and gene interactions) responsible for biomass yield. Thus, genetic and phenotypic characterizations allow genotype grouping, parental selection and efficient crossing designs (11).
Several types of molecular markers have been used to evaluate genetic diversity in alfalfa, including isoenzymes (25), Restriction Fragment Length Polymorphisms (RFLP) (8, 19), Random Amplified Polymorphic DNA (RAPD) (31), Simple Sequence Repeat (SSR) (10) and Amplified Fragment Length Polymorphisms (AFLP) (4). However, Julier et al. (18) indicated that SSR markers are useful tools to explore the alfalfa genome because their tetrasomic inheritance makes them effective for diversity analyses and genetic mapping in Medicago sativa. The advantages of SSR markers are the lack of numerous bands in the polyacrylamide gels and of the complexity that exhibit other markers, such as RFLP, AFLP o RAPD.
SSRs are co-dominant markers consisting of short tandem nucleotide repeats from 1 to 4 base pairs (bp). In plants, SSRs are distributed in the genome with an average frequency of 1 in 50,000 bp. In alfalfa the most common dinucleotide repeat motifs are AT and CT (10). The genetic basis of polymorphism is given by the variability of the number of tandem repeats and, consequently, the size of the amplified SSRs in individuals of a given species (24).
Several previous studies have used SSRs to evaluate genetic diversity among Medicago spp. and their populations. Diwan et al. (10) were the first to develop these markers in Medicago spp. Thus, these markers proved to be useful in the construction of genetic linkage maps (18), genetic diversity analysis (1, 12, 25, 27), QTL analysis (20), association mapping (28), and phylogenetic relationships (29).
The INTA Experimental Station at Manfredi, Córdoba, maintains a working alfalfa germplasm collection (commercial cultivars and experimental populations), which has still not been characterized at the molecular level. Because of their adaptation to the environmental conditions of the Pampas region and their high biomass yield potential, non-dormant cultivars (FD=8) are very important for the main alfalfa production areas of Argentina. Thus, molecular characterization of those FD=8 cultivars included in the Manfredi working collection, along with their agronomic characterization, will allow us to identify genetically distant genotypes useful for developing new cultivars with broader genetic basis and higher vigor than current ones. The goal of this work was to assess genetic diversity among FD=8 alfalfa genotypes included in the Manfredi germplasm collection using both agronomic and molecular characterizations.
Materials and methods
Plant material and experimental design
Forty non-dormant (FD=8) individuals belonging to five cultivars: DK 189, Bacana, Magna 801, CW 830 and Magna 804, were included in the evaluations (table 1). These individuals belong to the alfalfa breeding program of INTA Experimental Station. The assay was planted in 2007 at INTA Manfredi (31.5° S, 63.5° W, 292 m asl), following a nested plot design with three replications. Each genotype was represented by three clones per replication.
Table 1. Non-dormant individuals of each cultivar included in the diversity analysis.
Tabla 1. Individuos sin dormición, por cultivar, utilizados en el análisis de diversidad.

Agronomic characterization
Field evaluations were carried out between February and November 2008. The traits evaluated were biomass yield (BY), regrowth speed (RS) and reaction to three foliar diseases: spring-black stem (SBS) caused by Phoma medicaginis Malbr. & Roum var. medicaginis Boerema, lepto leaf spot (LLS) caused by Leptosphaerulina briosiana (Poll.) Graham & Luttrell, and rust caused by Uromyces striatus Schroet (17). BY was assessed as total biomass production of three cuttings made at 10% flowering (30); two cuttings were made in autumn and the other one in spring 2008. Forage material was dried to constant weight at 70°C. RS was measured 10 days after each cutting, considering average plant height of vegetative sprouts (30). Three reactions to foliar diseases were evaluated between March and April 2008 according to a visual severity scale that ranged from 0 (disease absence) to 5 (disease presence in over 50% of total leaf area) (13) (table 2).
Table 2. Foliar disease severity scale used for disease evaluation.
Tabla 2. Escala de severidad para la evaluación de las enfermedades.

Molecular characterization
Genomic DNA was extracted from young lyophilized leaves using NucleoSpin Plant II (Machery-Nagel, Germany). A total of 18 SSR previously published primer pairs (10, 18) were used to amplify single loci across the alfalfa genome (table 3).
Table 3. SSR primer sequences used for genotyping.
Tabla 3. Secuencia de los cebadores SSR empleados en la genotipificación.
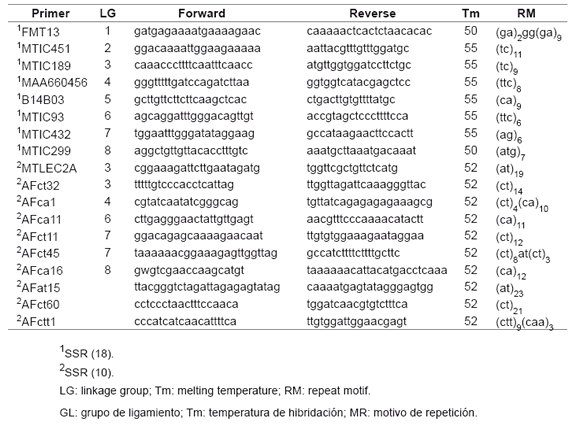
PCR reactions were conducted in an AB GeneAmp System 9700 (Applied Biosystems, USA) thermocycler. A denaturation period of 4 min at 94°C was followed by 35 cycles of 30 sec at 94°C, 1 min at Tm (table 3, page 184) and 1 min at 72°C and then 10 min at 72°C for final extension (12). Reactions were carried out in a final volume of 12.5 μL, containing 1X buffer, 0.2 mM of each dNTP, 25 pM of SSR forward and reverse primers, 2 mM of MgCl2, 1U of Taq Polymerase (Fermentas, USA) and 15 ng of DNA.
PCR products were resolved in 6% polyacrylamide denaturing gels, run at 50 W constant power for 2 hours and visualized using a silver staining kit (Promega, USA). Two molecular weight standards were used (25 bp and 10 bp) (Invitrogen, USA).
Statistical analysis
Analyses of variances (ANOVA) for BY, RS, SBS, LLS and R agronomic traits were performed to compare 40 individuals. Variances were analyzed using a mixed model from InfoStat (9). Multivariate profiles were determined to visualize the agronomic traits evaluated.
A Principal Component Analysis (PCA) was performed from standardized agronomic data (3). Agronomic distances between all pairs of individuals evaluated were calculated using Gower's coefficient (15) and UPGMA (Unweighted Pair-Group Method Analysis) algorithm. The molecular cluster was obtained from genetic distances and UPGMA algorithm. The genetic distances were calculated with Nei's standard coefficient (22). The molecular matrix was created by codifying each allele band on the polyacrylamide gel with a letter. The cluster branch support was determined by multiscale boostrap resampling (nboot= 10000) using Pvclust an R package (2). Genetic diversity (D) was calculated as D = 1- Σpij2 , where pij2 is the frequency of allele i in locus j. Nei's expected heterozygosity (He) (23) was calculated as:

where N is the number of individuals in the sample.
Polymorphic Information Content (PIC) (7) was calculated as follows:

Correlation between agronomic and molecular distances was obtained by means of a Generalized Procrustes Analysis (GPA) (14). Statistical analyses were performed using Info-Gen statistical software (2).
Results
Agronomic characterization
Multivariate profiles showed agronomic variability for the traits evaluated (figure 1, page 186; figure 2, page 187; figure 3, page 188).

Figure 1. Multivariate profiles of average biomass yield in grams (g) per individual, per cultivar and cutting. a) DK 189, b) Bacana, c) Magna 801, d) CW 830 and e) Magna 804.
Figura 1. Perfil multivariado de la producción de materia seca promedio en gramos (g), por individuo, por cultivar y por corte. a) DK 189, b) Bacana, c) Magna 801, d) CW 830 y e) Magna 804.

Figure 2. Multivariate profiles of average regrowth speed in centimeters (cm) per individual, per cultivar and cutting. a) DK 189, b) Bacana, c) Magna 801, d) CW 830 and e) Magna 804.
Figura 2. Perfil multivariado de la velocidad de rebrote promedio medida en centímetros (cm) por individuo y por cultivar después de cada corte. a) DK189, b) Bacana, c) Magna 801, d) CW 830 y e) Magna 804.
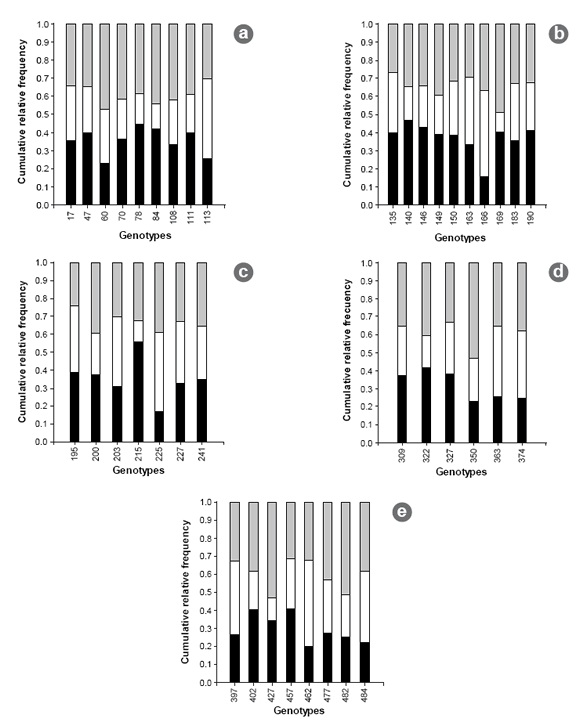
Figure 3. Cumulative relative frequency for lepto leaf spot (black), rust (white) and spring-black stem (grey) per individual and per cultivar. a) DK 189, b) Bacana, c) Magna 801, d) CW 830 and e) Magna 804.
Figura 3. Frecuencia relativa acumulada para mancha ocular (negro), roya (blanco) y tallo negro de primavera (gris) por individuo y por cultivar. a) DK 189, b) Bacana, c) Magna 801, d) CW 830 y e) Magna 804.
To facilitate the visualization of results, the analysis was performed by differentiating among cultivars. The results obtained for average BY for each individual per cutting varied between 29 g (figure 1b, page 186) and 160 g (figure 1c, page 186) of dry weight, and average RS ranged from 13.3 to 36.6 cm in height (figure 2a, page 187). Regarding behavior against foliar disease, genotypes displayed a wide range of responses, with severity levels varying from 1 to 4. In general, all three diseases were present in all individuals, prevailing in one individual in only 37.5% of cases (figure 3, page 188).
Molecular characterization
For the molecular analysis with SSR markers, only six of 18 SSR primer pairs (33.3%) were used, which were chosen according to their amplification profiles. A total of 84 alleles were identified, with an average of 14 alleles per locus. Genetic diversity coefficients estimated are summarized in table 4. B14B03 and AFca1 loci presented an observed heterozygosity (Ho) value of 1, indicating that all individuals displayed different genotypes for those loci. Amplification profile for 40 genotypes analyzed with AFca1 locus is shown in figure 4.
Table 4. Genetic diversity coefficients per locus.
Tabla 4. Índices de diversidad genética por locus.
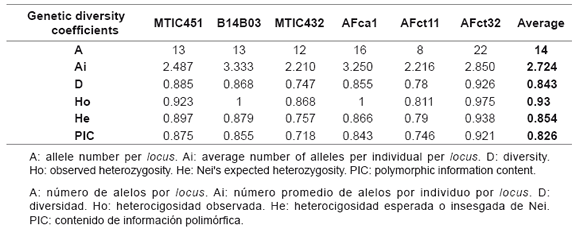

Figure 4. Amplification profile of AFca1 locus in 6% denaturing polyacrylamide gel. bp: base pairs.
Figura 4. Perfil de amplificación del locus AFcal en el gel de poliacrilamida al 6%. pb: pares de base.
Statistical analysis
Results of ANOVA were significantly different (p ≤ 0.05) among individuals for BY and R, but were non-significant (p ≥ 0.05) for RS, LLS and SBS. PCA was performed with standardized agronomic data, with the first two principal components explaining 63% of total variance. SBS, BY and RS were the most important variables, with a positive correlation for PC1 (figure 5). Individuals on the right of axis 1 were associated with high BY, RS and severity to SBS. Instead, individuals on the left of axis 1 were associated with negative values of the mentioned traits. The most important variables for PC2 were rust and LLS, displaying a negative correlation. These two variables allowed the formation of two groups of individuals: rust-sensitive individuals and LLS-sensitive individuals.
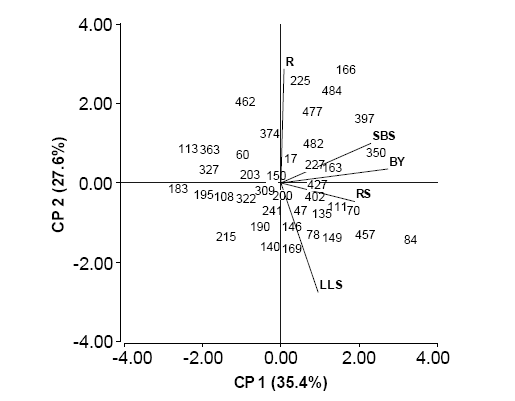
Figure 5. PCA based on the agronomic traits. R: rust, SBS: spring black stem, LLS: lepto leaf spot, BY: biomass yield and RS: regrowth speed.
Figura 5. PCA con base en los caracteres agronómicos. R: roya, TNP: tallo negro de primavera, MO: mancha ocular, PF: producción de forraje y VR: velocidad de rebrote.
Figure 6 (page 191) shows the agronomic dendrogram, in which five agronomic clusters were formed at distance value 0.8 (clusters A to E) with bootstrap P values above 83%. Individuals 84 (cluster A) and 166 (cluster B) formed two separated groups. Cluster E (P = 90%) associated individuals from all five cultivars, although with a high number of individuals from Bacana and DK189. Cluster C (P = 81%) grouped most individuals from Magna 804 and cluster D (P = 96%) comprised individuals from cultivars Magna 801 and CW 830, as well as the remaining Bacana individuals.
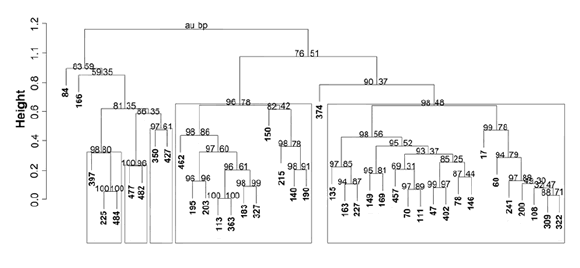
Figure 6. Dendrogram of agronomic traits showing relationships between the individuals analyzed. Frames show groups with bootstrap P ≥ 95%. Au: approximately unbiased (left values). Bp: Bootstrap probability (right values).
Figura 6. Dendrograma agronómico que muestra las relaciones entre los individuos evaluados. Los recuadros muestran los grupos con un valor bootstrap P ≥ 95%. Au: aproximación insesgada (valor de la izquierda). Bp: probabilidad Bootstrap (valor de la derecha).
Figure 7 (page 191) shows the dendrogram of the genetic distances with bootstrap P values above 84%. No cut-off point could be established to define groups because the genotypes from all cultivars tended to form small groups at distance value 0.6; except one group (P = 92%) that included individuals from all five cultivars with a high number of Magna 801 (frame), (figure 7, page 191).
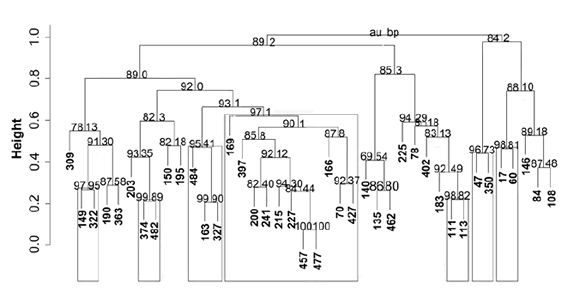
Figure 7. Molecular dendrogram obtained from data of six SSR loci analyzed. Frames show groups with bootstrap P ≥ 95%. Au: approximately unbiased (left values). Bp: Bootstrap probability (right values).
Figura 7. Dendrograma molecular con base en los seis loci SSR analizados. Los recuadros muestran los grupos con un valor bootstrap P ≥ 95%. Au: aproximación insesgada (valor de la izquierda). Bp: probabilidad Bootstrap (valor de la derecha).
The GPA revealed a consensus of 65.4% among molecular and agronomic clusters (figure 8). Projection of individuals on axis 1 revealed certain differences among individuals. Genotypes of cultivar CW 830 were set on the left of the axis, whereas those of DK 189 and Magna 804 were placed on the right of the axis. On the other hand, individuals of cultivars Magna 801 and Bacana were homogeneously distributed on both sides of the axis.

Figure 8. Ordering consensus of 40 individuals analyzed based on the first two axes of GPA biplot.
Figura 8. Ordenamiento consenso de los 40 individuos analizados con base en los dos primeros ejes del biplot APG.
Discussion
The flanking regions of SSR markers between genotypes of a single species, and sometimes a single genus, are usually preserved. For this reason, more than 80% of SSR loci developed in M. truncatula amplified in alfalfa (18). However, of the eight SSR primers designed in M. truncatula that were used in the present study, only MTIC451, B1B03 and MTIC432 amplified in the genotypes analyzed. This is probably related to the higher variation of SSR loci in autotetraploid species than in diploid species of the genus. Julier et al. (18) observed a similar situation when transferring SSR primers designed in M. truncatula (2n=2x=16) to M. sativa.
About 70% of the genotypes analyzed in this work presented two-three alleles per locus in most loci, with an average of 2.724 (table 4, page 189). Four rare alleles in two individuals of related cultivars (Magna 801 and Magna 804) (data not shown) were detected. Although the sample size was low, this situation highlights the high level of variability among the genotypes analyzed. Based on number of alleles per locus and on the average high genetic diversity detected (D = 0.843) (table 4, page 189), we conclude that there is a considerable molecular variability for the SSR loci studied and a high degree of heterozygosity among the genotypes analyzed.
The PIC analysis seeks to quantify polymorphism in a certain loci. The six loci analyzed in this work presented high PIC values (between 0.72 and 0.92), which were obviously related to the previously indicated high number of alleles per locus. According to Botstein et al. (7), who considered that PIC > 0.5 could indicate a highly polymorphic loci, we conclude that all SSR loci analyzed in the present study are a highly polymorphic and informative group (average PIC of 0.826) (table 4, page 189).
Due to the extreme sensitivity of alfalfa to inbreeding, the use of genetically unrelated parents is essential for genetic improvement programs. Consequently, defining genetically distant individuals -whether by agronomic traits or molecular markers- is an important tool. In this work, cluster analysis based on agronomic traits tended to include most of the individuals of a particular cultivar in the same group, although each group generally included individuals of different cultivars (figure 6, page 191). The low discriminating power displayed by the agronomic analysis may indicate that the low number of individuals of each cultivar or the traits included in this study were not sufficient to explore the total variability among the individuals analyzed, which is consistent with findings reported by Bagavathiannan et al. (1).
Cluster analysis based on molecular markers did not detect a clear grouping pattern among cultivars; rather, it showed a tendency to group individuals independently of the original cultivar (figure 7, page 191). This may be a consequence of the likely closed genetic background among non-dormant cultivars, even when they come from different breeding programs. In the search for improved materials, most of the breeding efforts are focused on selecting from or crossing elite materials, which may result in using genetically related parents in many of those programs.
Another factor that might have influenced our results could be the low number of SSR out molecular markers, as well as the limited number of individuals analyzed. This lack of clustering was proven by the GPA, which reflects the high agronomic and molecular variability among the genotypes analyzed, and the likely kinship degree shared by the cultivars (figure 8, page 192) (Basigalup, personal communication, 2008).
Accordingly, Flajoulot et al. (12) stated that a larger sampling size would allow detection of rare alleles present in low frequencies. Similarly, Herrmann et al. (1) detected a higher number of alleles when increasing the size of the population analyzed, and recommended the use of 40 genotypes per cultivar as a reasonable sample size to assess genetic diversity and molecular differentiation of genetically related tetraploid alfalfa populations. In the present study, the low number of genotypes per cultivar used could have been offset by the use of a higher number of SSR markers (16) or complemented with other types of molecular markers, such as RAPDs (21) or AFLPs (26).
Conclusion
The results show that both agronomic and molecular characterizations with SSR markers, allow to assess the genetic diversity in alfalfa genotypes included in the Manfredi working collection. This, in turn, will make it possible to combine distant genotypes for the development of synthetic populations with higher vigor, biomass and higher tolerance to main foliar diseases than current genotypes.
1. Bagavathiannan, M. V.; Julier, B.; Barre, P.; Gulden, R. H.; Van Acker, R. C. 2010. Genetic diversity of feral alfalfa (Medicago sativa L.) populations occurring in Manitoba, Canada and comparison with alfalfa cultivars: an analysis using SSR markers and phenotypic traits. Euphytica. 173: 419-432. [ Links ]
2. Balzarini, M.; Di Rienzo, J. A. 2004. Infogen: Software estadístico para análisis de datos genéticos. Universidad Nacional, Córdoba. Available in: http://www.info-gen.com.ar
3. Balzarini, M.; Teich, I.; Bruno, C.; Peña, A. 2011. Making genetic biodiversity measurable: a review of statistical multivariate methods to study variability at gene level. Rev. FCA UNCUYO. 43(1): 261-275. [ Links ]
4. Barcaccia, G.; Albertini, E.; Rosellini, D.; Tavoletti, S.; Veronesi, F. 2000. Inheritance and mapping of 2n-egg production in diploid alfalfa. Genome. 43: 528-537.
5. Basigalup, D. H.; Rossaningo, R. 2007. Panorama actual de la alfalfa en la Argentina. En: Basigalup, D. H. (Ed.). 2007. El cultivo de la alfalfa en la Argentina. Córdoba, Argentina. Ediciones INTA. p. 13-25.
6. Barnes, D. K.; Goplen, B. P.; Baylor, J. E. 1988. Highlights in the USA and Canada. In: Hanson, A. A.; Barnes, D. K.; Hill, R. R. (Eds.). 1988. Alfalfa and Alfalfa Improvement. J. Soc. Agron. Monogr. Madison, USA. 29: 1-24. [ Links ]
7. Botstein, D.; White, R. L.; Skolnick, M.; Davis, R. W. 1980. Construction of a genetic linkage map in man using restriction fragment length polymorphism. Am. J. Hum. Genet. 32: 314-331.
8. Brummer, E. C.; Kochert, G.; Bouton, J. H. 1991. RFLP variation in diploid and tetraploid alfalfa. Theor. Appl. Genet. 83: 89-96.
9. Di Rienzo, J. A.; Casanoves, F.; Balzarini, M. G.; Gonzalez, L.; Tablada, M.; Robledo, C. W. InfoStat versión 2011. Universidad Nacional de Córdoba. Available in: http://www.infostat.com.ar
10. Diwan, N.; Bhagwat, A. A.; Bauchan, G. R.; Cregan, P. B. 1997. Simple sequence repeat DNA markers in alfalfa and perennial and annual Medicago species. Genome. 40: 887-895. [ Links ]
11. Ferreira, M. E.; Grattapaglia, D. 1996. 2da ed. Introdução ao Uso de Marcadores Moleculares em Análise Genética. EMBRAPA, São Paulo, Brasil. 220 p.
12. Flajoulot, S.; Ronfort, J.; Baudouin, P.; Barre, P.; Huguet, T.; Huyghe, C.; Julier, B. 2005. Genetic diversity among alfalfa (Medicago sativa) cultivars coming from a breeding program, using SSR markers. Theor. Appl. Genet. 111: 1420-1429. [ Links ]
13. Gentili, C. M. V. 2008. Interacción entre resistencia a antracnosis (Colletotrichum trifolii) y estadíos vegetativos en sintéticos de alfalfa (Medicago sativa). Tesina de grado. Universidad Nacional de Villa María, Córdoba, Argentina. 45 p.
14. Gower, J. C. 1975. Generalizad Procrustes Analisys. Physchometrika. 40: 33-51.
15. Gower, J. C. 1985. Measures of similarity, dissimilarity and distance. In: Kotz, S.; Jonhson, N. (Ed.). Encyclopedia of statistical science. Wiley. New York, USA. Vol.5, p. 397-405.
16. Herrmann, D.; Flajoulot, S.; Julier, B. 2010. Sample size for diversity studies in tetraploid alfalfa (Medicago sativa) based on codominantly coded SSR markers. Euphytica. 171: 441-446. [ Links ]
17. Hijano, E. H.; Pérez Fernández, J. 1995. Enfermedades de la alfalfa. En: Hijano, E. H.; Navarro, A. (Eds.). La alfalfa en la Argentina. Manuales N° 11. Cap. 7, p. 127-146. INTA Mendoza.
18. Julier, B.; Flajoulot, S.; Barre, P.; Cardinet, G.; Santoni, S.; Huguet, T.; Huyghe, C. 2003. Construction of two genetic linkage maps in cultivated tetraploid alfalfa (Medicago sativa) using microsatellite and AFLP markers. BMC Plant Biology. p. 19. Available in: http://www.biomedcentral.com/1471-2229/3/9
19. Kidwell, K. K.; Austin, D. F.; Osborn, T. C. 1994. RFLP evaluation of nine Medicago accessions representing the original germplasm sources for North American alfalfa cultivars. Crop Sci. 34: 230-236.
20. Maureira-Butler, I. J.; Udall, J. A.; Osborn,T. C. 2007. Analyses of a multi-parent population derived from two diverse alfalfa germplasms: testcross evaluations and phenotype-DNA associations. Theor. Appl. Genet. 115: 859-867. [ Links ]
21. Mengoni, A.; Gori, A.; Bazzicalupo, M. 2000. Use of RAPD and microsatellite (SSR) variation to assess genetic relationships among populations of tetraploid alfalfa, Medicago sativa. Plant Breeding. 119: 311-317.
22. Nei, M. 1972. Genetic distance between populations. Amer. Nat. 106: 283-292.
23. Nei, M. 1978. Molecular evolutionary genetics. Columbia University Press. New York, USA. 512 p.
24. Picca, A.; Helguera, M.; Salomón, N.; Carrera, A. 2004. Marcadores moleculares. En: Echenique, V.; Rubinstein, C.; Mroginski, L. (Eds.). Biotecnología y Mejoramiento Vegetal. Buenos Aires, Argentina. Ediciones INTA. p. 61-68.
25. Quiros, C. F.; Bauchan, G. R. 1988. The genus Medicago and the origin of the Medicago sativa complex. In: Hanson, A. A.; Barnes, D. K.; Hill, R. R. (Eds.). Alfalfa and Alfalfa Improvement. J. Soc. Agron. Monogr. Madison, USA. 29: p. 93-124.
26. Riday, H.; Brummer, E. C.; Campbell, T. A.; Luth, D.; Cazcarro, P. M. 2003. Comparisons of genetic and morphological distance with heterosis between Medicago sativa subsp. sativa and subsp. falcata. Euphytica. 131: 37-45. [ Links ]
27. Sakiroglu, M.; Doyle, J. J.; Brummer, E. C. 2010. Inferring population structure and genetic diversity of broad range of wild diploid alfalfa (Medicago sativa L.). Theor. Appl. Genet. 121: 403-415.
28. Sakiroglu, M.; Sherman-Broyles, S.; Story, A.; Moore, K. J.; Doyle, J. J.; Brummer, E. C. 2012. Patterns of linkage disequilibrium and association mapping in diploid alfalfa (M. sativa L.). Theor. Appl. Genet. 125: 577-590.
29. Sakiroglu, M.; Brummer, E. C. 2013. Presence of phylogeographic structure among wild diploid alfalfa accessions (Medicago sativa L. subsp. microcarpa Urb.) with evidence of the center of origin. Genet. Resour. Crop. Evol. 60: 23-31. [ Links ]
30. Spada, M. del C. (Ed.). 2008. Avances en alfalfa. Ensayos territoriales. En: Red de evaluación de cultivares de alfalfa N° 18. Córdoba, Argentina. 89 p.
31. Yu, K.; Pauls, K. P. 1993. Rapid estimation of genetic relatedness among heterogeneous populations of alfalfa by random amplification of bulked genomic DNA samples. Theor. Appl. Genet. 86: 788-794.
Acknowledgements
To INTA Manfredi staff: J. Peroglia, J. Nieva, M. C. Scorcione, M. Alegre, E. Alverani, F. Ludueña, H. Ludueña, B. Azagra, C. Castellano, C. Spada and J. Zabala.
Finally, funding provided by CVT Alfalfa INTA-Produsem S. A. is much appreciated.


