


Services on Demand
Journal

Article
 English (pdf)
 Article in xml format
 Article references
 Send this article by e-mail
Indicators
-
 Cited by SciELO
Related links
-
 Similars in
SciELO
Similars in
SciELO
Share

 Permalink
Revista de la Facultad de Ciencias Agrarias. Universidad Nacional de Cuyo
Print version ISSN 1853-8665On-line version ISSN 1853-8665
Rev. Fac. Cienc. Agrar., Univ. Nac. Cuyo vol.50 no.1 Mendoza June 2018
ORIGINAL ARTICLE
Proposal for severe injury reduction targets in Spain by territory and sector. The importance for rural areas of traffic accident
Propuesta de objetivos territoriales y sectoriales de reducción de heridos graves. Importancia de los accidentes de tráfico en áreas rurales
María Dolores Ramírez Román 1, Xavier Bolívar Lastra-Bravo 2, Alfredo Tolón-Becerra 1, Fernando Bienvenido-Bárcena 3, Isabel Flores-Parra 3
1 University of Almeria. Area of Engineering Projects. Ctra Sacramento s/n. La Cañada de San Urbano. 04120. Almeria. Spain. atolon@ual.es
2 Universidad Central del Ecuador. Facultad de Ciencias Agrícolas. Carrera de Turismo Ecológico. Jerónimo Leiton y Av. La Gasca s/n. Ciudadela Universitaria. Quito. 170521. Ecuador.
3 University of Almeria. Dept. of Computer Science.
Originales: Recepción: 01/03/2017 - Aceptación: 31/03/2017
ABSTRACT
The Spanish road safety strategy for 2011-2020 proposes a 35% reduction in the number of severe injuries in 2011-2020. In this context, this article analyses provincial traffic accident rates in Spain by type of road and applies a nonlinear distribution methodology to dynamic severe injuries reduction targets for 2011-2020 for the purpose of setting accident rate targets in each of the Spanish provinces. Targets were weighted considering 2010 as the base year. This resulted in proposals for reducing the number of severe injuries in each province by type of road as a function of the starting situation of the indicators used in the study. In general, higher reduction must be made on highway and other type of roads (including city streets), and provinces with low population density (rural areas) such as Avila, Cuenca and Soria. The results found seek to provide policymakers with a more local view for achieving the overall Spanish traffic safety policy target, mainly for rural areas.
Keywords: Spanish road safety policy; Safety indicators; Non-linear distribution method for reduction targets; National comparisons; Spain
RESUMEN
En la Estrategia de seguridad vial 2011-2020 para España se ha propuesto reducir el número de heridos graves en un 35% para el período 2011-2020. En este contexto, en este artículo se analiza la siniestralidad vial en España a nivel provincial y por tipo de carretera, y se aplica una metodología de distribución no lineal de valores objetivos dinámicos de reducción del número de heridos graves para el período 2011-2020, con el objeto de establecer objetivos provinciales de siniestralidad, para cada una de las provincias españolas. La ponderación de los valores objetivos se realizó considerando como año base a 2010. Como resultado se obtuvieron propuestas de reducción del número de heridos graves para cada provincia, y por tipo de carretera, en función de la situación inicial de los indicadores considerados en el estudio. En general, las mayores reducciones se deberían alcanzar en vías convencionales y otro tipo de vía (incluido vías urbanas), y en provincias con menor densidad de población (áreas rurales) como Ávila, Cuenca y Soria. Los resultados obtenidos buscan dar una visión más local a los tomadores de decisiones en relación con la consecución del objetivo de la política de seguridad vial en el conjunto de España, especialmente en áreas rurales.
Palabras claves: Política de seguridad vial española; Indicadores de seguridad vial; Método de distribución no lineal de objetivos de reducción; Comparación nacional; España
INTRODUCTION
Road safety in Spain has undergone a very positive change in recent years, with a 53% reduction in the number of fatalities from 2000 to 2009, when it was in line with the European Road Safety Strategy and the 50% reduction target for 2010 (4). These improvements are mainly the result of an increase in the use of safety systems, such as helmets (73% to 98.9%) and safety belts (70% to 90.6%), and also a reduction in risk factors, such as average speed (-2 km/h) and drinking while driving (deceased drivers with a blood alcohol level over 0.3 g/l went from 35% to 29%). These measures have previously been identified as among the most effective in road safety (13, 16, 28, 29), so the results are therefore in agreement with various cost/benefit studies done on road safety policies demonstrating that the most progress in this field may be achieved by applying cost-effective road safety measures (11), such as those applied in Spain, and that in general require more studies to identify new measures (24).
These positive changes in user behaviour may quite possibly have been due to having set reduction targets (for example, 50% in road fatalities), which have acted as a catalyst for the efforts of the various actors involved in road safety, who are aware that they alone do not exert a direct effect on the results of the programs implemented (21, 37, 38). Better infrastructures and modernization of vehicles in circulation and their safety systems have also contributed to improved road safety in Spain (4). These measures have been validated in previous studies (28, 36). But road safety policy must continue to be strengthened, and especially, coordination on different levels of competence (national, regional and local governments) and among the many qualified economic and social agents involved (4).
More road safety requires an efficient road safety policy based on an optimum set of measures and targets selected by the corresponding authorities, who must be committed to their fulfilment and achievement as an indispensable part of the process (10, 15, 29). Therefore, Spain is concentrating its efforts to reduce traffic accidents on 13 specific quantifiable scientific indicators identified for 2020 in the Spanish 2011-2020 Road Safety Strategy (4).
The Spanish strategy includes the principles considered by the EU in COM(2010) 389 final, "Communication from the Commission to the European Parliament, the Council, the European Economic and Social Committee and the Committee of the Regions towards a European road safety area: policy orientations on road safety 2011-2020", which are "Striving for the highest road safety standards throughout Europe", "An integrated approach to road safety" and "Subsidiarity, proportionality and shared responsibility" (12). Under these principles, society would assume its responsibility for achieving more road safety, a stronger bond with social safety policy in other fields, and especially, stronger true governance where different levels of government acquire more responsibility for fulling the commitments made and taking specific action.
One of the indicators formulated in the Spanish Road Safety Strategy was "35% reduction in the number of severe injuries", to respond to the consequences suffered by those who, though they have not lost their lives, have been severely injured and their psychophysical conditions impaired by traffic accidents.
Setting the 13 indicators and their quantitative targets in the Spanish strategy reinforces the need to set thresholds and quantitative targets.
The more ambitious the quantitative targets are, the more effect they have on policymakers and on the execution of road safety programs (9, 35). Therefore, a road safety target must be achievable and ambitious, and not demotivate by being too ambitious or cause complacency by being too modest (35). Sze et al. (2014), in a study evaluating the likelihood of success of road safety targets and the factors that influence them, found that less ambitious targets had more probability of success. This reinforces the conclusion reached in previous studies that setting rational but reachable targets is essential to road safety policy, and that such ambition must vary by region.
Therefore, the target for reducing accidents marked by road safety policy must be different in each geographic area, be found based on its distance from a desirable value and be more ambitious the more severe the social problem is (26). In this sense, the traffic accident rates differ among rural and urban areas, so different targets must be set.
Zwerling et al. (2005) summarize potential explanations for the differences in traffic accident rates between rural and urban areas; among them the distances travelled are higher in rural areas, less likely behaviour for adopting safety measures (wearing seat belts or alcohol patterns), less safety conditions on rural roads and rural vehicles, higher severity on rural crashes due different speed limits or road conditions, on rural areas medical attention take more time and the quality of the medical response may not be as good.
In Spain, a negative correlation between population density and population and the number of accidents per inhabitants and fatalities was founded (27) due the areas with the lowest populations (rural areas) are mountainous and non-urban, and therefore, have less developed road networks, with a more irregular layout and steeper grades, and with fewer high capacity roads.
Spain has 52 provinces and the purpose of this article is to widen the methodology proposed by Tolón et al. (26) by applying it to the severe traffic injuries indicator, and sectorize its application by province and type of road where the accident happened. Thus provincial targets for reducing the number of severe injuries in 2010-2020 are found by type of road. It further intends to reinforce the debate on the use of different indicators of traffic accident rates in weighting territorial reduction targets for number of injuries, especially for rural areas where severity of traffic accidents is usually higher. Eksler (2010) and Eksler and Lassarre (2008) believe that comparative evaluation on a subnational level can provide interesting new opportunities for improving road safety in the territories.
Analysis of the evolution of accident rates during 2000-2014
To evaluate the effects of road safety programs, not only the current situation in different countries must be compared, but also their evolution over time (32). Therefore, data and evolution of the provincial totals of severe injuries and type of road are analyzed below.
In particular, the changes in means and ranges (they are distributed within) over time show their variation. In addition to the analysis of change, indicators are also analyzed for 2010, year of reference for application of the formula.
Real evolution in the number of severe injuries in traffic accidents
In 2000-2014, evolution in the reduction of the number of severe injuries in Spain was positive (65.5%) (figure 1, page 277).
Figure 1. Severe injuries per 100000 inhabitants in Spanish provinces in the period2000-2014.
Figura 1. Heridos graves por 100 000 habitantes en las provincias españolas en el período 2000-2014
But evolution in the provinces was irregular, with reductions of 87.5 to 26.8%. Madrid stands out as the only province in which the number of severe injuries did not change by over 50%, which Barcelona, a province with similar population and vehicle pool characteristics, did achieve. Most (32) had a 12 to 33% reduction. That is, a higher reduction than Spain as a whole.
The wide variation in reduction percentages in Ceuta is due to its small population and vehicle pool. Almeria was able to reduce fatality on the road by 75.9% from 2000 to 2014, in spite of the negative trend (increase in number of severe injuries) from 2001 to 2008. Fatality in 2014 was 78.9% lower than in 2008.
It was observed that the number of severe injuries varied more in 2000-2009, and stabilized in 2010-2014, when although figures were more stable, always tended toward reduction. Nor is behaviour similar among the provinces with the heaviest populations, such as Madrid, Barcelona, Valencia, Seville, Alicante, Malaga and Murcia.
In 2010-2014, the reduction in the number of severe injuries in Spain was 20.2%, and provincial data vary strongly (26.8±23.8%). Although the trend is positive in Alava, Albacete, Balearic Islands, Lleida, Madrid, Asturias, Las Palmas and Santa Cruz de Tenerife, the number of severe injuries increased during this period by 243. Half of the severe injuries in Spain occurred in Barcelona, Valencia, Pontevedra, Alicante, Seville, Malaga and Girona, along with Madrid and the Balearic Islands, and progress was below the Spanish mean, except for Seville (27.5%). This situation must be reversed for Spain to reach the target set, and a greater effort must be made there than in the rest of the provinces.
Severe injuries per population
In 2000-2014, the number of severe injuries in Spain per population went down from 68.6 severe injuries per 100 000 inhabitants in 2000 to 20.5 severe injuries per 100 000 inhabitants in 2014 (figure 1, page 277). It should be favorably stressed that the number of severe injuries per population did not increase in any of the provinces.
The provinces with the greatest reduction in this indicator were Soria, Alava and Cuenca with decreases of over 100 severe injuries per 100 000 inhabitants, this provinces are characterized by lower population density. On the contrary, Madrid, Ceuta, Cádiz, Barcelona and Seville, had the lowest reductions with decreases of less than 30 severe injuries per 100 000 inhabitants.
In 2000, the severe injury per population indicator in the Spanish provinces varied from 27.9 (Ceuta) to 184.8 (Soria) severe injuries per 100 000 inhabitants. This range was lower in 2014, from 7.6 (Ceuta) to 48.0 (Huesca) severe injuries per 100 000 inhabitants (figure 1, page 277).
Analysis of the severe injuries per population indicator in 2014 shows that in 23 of the 52 Spanish provinces it was below the one for Spain, but there was no direct relationship with the resident population in each province.
In spite of the reduction in the severe injuries per 100 000 inhabitants indicator in the Spanish provinces in 2010, they still varied strongly, with significant dispersion among the provinces. These data, means and their dispersion must continue going down to accentuate convergence toward the desired value (zero) of this indicator.
Severe injuries by type of road in 2000-2014
During the period 2000-2014, a significant increase was observed in the percentage of severe injuries on other types of roads (table 1, page 279) over total for all Spanish roads.
Table 1. 2000-2014 evolution in the number of severe injuries by type of road *.
Tabla 1. Evolución 2000-2014 del número de heridos graves por tipos de vía *.

This increase was mainly in 2011-2014, when it increased more than 20 percentage points. On the contrary, the number of severe injuries on highways decreased significantly over total injuries. On other roads considered in the study, slight reductions from 2000 were observed in 2014, and very few differences compared to the distribution in 2010.
The differences observed in the number of deaths in the distribution by roads is due to a change in the methodology applied by the Dirección General de Tráfico (Directorate General of Traffic -DGT) starting in 2011, whereby victims are followed up after 24 hours from the accident, leading to an increase in severe and minor injuries, mainly in urban areas.
Data on the starting year (2010)
In 2010, the severe injuries per 100 000 inhabitants indicator for Spanish provinces varied in a range of 9.4 (Las Palmas) to 80.3 (Avila) severe injuries per 100 000 inhabitants (figure 1, page 277). The mean of the severe injuries per 100 000 inhabitants indicator was 32.5±15.7.
The highest number of severe injuries occurred on highways (figure 2, page 280), with a mean of 114.1±77.3 severe injuries and a mean total percentage of 56.1±16.8%.

Figure 2. Serious injuries per road type (%) in Spanish provinces in 2010.
Figura 2. Heridos graves por tipo de vía (%) en las provincias españolas en 2010.
On other types of roads, the mean of severe injuries was 79.7±167.5, with a mean total percentage of 27.0±19.8%. The high variation in these values is due to the high number of severe injuries in the most heavily populated provinces.
The averages for the severe injuries per 100 000 inhabitants indicator on the various types of road included in the study were 0.8±1.4 (motorway), 3.4±3.6 (expressway), 18.9±12.5 (highway), 1.2±1.4 (local road), 0.1±0.1 (service road), 0.2±0.4 (interchange ramp) and 8.0±6.0 (other).
The variation among provinces observed in the severe injuries per 100 000 inhabitants indicator and by type of road where they occurred justifies application of the Tolón-Becerrra et al. (2009), methodology to diversify, both by territory (by territorial units) and sector (by type of road) the criteria used by policymakers for decision making.
MATERIALS AND METHODS
Parameters considered in weighting the accident rate reduction targets
In COM(2010) 389 final, Member States were encouraged to design national road safety strategies considering their specific starting points, needs and circumstances (12). Thus the methodology by Tolón- Becerra et al. (2009), is applied to a new scenario, the number of severe injuries in traffic accidents and two specific circumstances, the territory (provinces) and type of road where the injuries occurred. This way, policymakers can design new policies based on these parameters.
Study of the data available enables better comprehension of the road safety situation, which is usually done by spatiotemporal comparison of accident rate data (7, 15, 32).
Researchers and policymakers have concentrated on studying temporal variations, even though most of the factors which enter into road safety are spatial (7).
Among them, the relative level of motorization, the territory (country, region, province, municipality, etc.), topography, type of users on the road and type of vehicle (18, 20, 30). Theofilatos and Yannis (2014) also suggested that most of the studies on road safety concentrate on expressways or urban expressways, and the rest of types of roads have been studied very little, since although they are more complicated to analyse in terms of traffic, they are of more interest in terms of road safety.
Indicators for comparing road safety among countries should be relevant, measurable, understandable, specific and sensitive, and reliable comparable data must be available for them (14). This recommendation should be taken into even more consideration when working on subnational levels where fewer quality data are available.
The decision on how to specify groups of similar areas and the size of groups for comparative evaluation should also be considered (1) such that researchers can interpret the results found.
One of the available indicators which provide real information on the degree of road safety is the number of severe injuries in traffic accidents normalized per population. Its importance for formulation of road safety policies is given by its consequences to disability and healthcare costs, so it is usually used the most often as an additional indicator of road safety (33, 34).
Hughes et al. (2015), think road safety strategies should use fatalities and severe injuries as primary indicators of road safety. Shen et al. (2015), suggest that the situation of severe traffic injuries merits more political attention than fatalities in comparative evaluation of road safety. More so if the long-term effects on health of those severely injured in traffic accidents, still not well documented, are considered (2).
It is therefore suggested that the methodology by Tolón-Becerra et al. (2009), be widened by applying it to a new scenario, the number of severe traffic injuries and the type of road where they occurred. This methodology is based on the fair and logical principle that a greater effort should be made to reduce the number of injuries in those territories which had the worst values in the year of reference (territorial differentiation) and also for those types of roads with the worst values (differentiation by sector).
This methodology was applied in this study to the Spanish provinces, which are NUTS2 in the statistical territorial units nomenclature, on both sector and territory levels.
The sector units were the seven types of roads differentiated in Spanish accident rate statistics, and the total sector was all of the roads in Spain. In the territorial application, the total geographic area considered was Spain, and the geographic units were its 52 provinces, so that severe traffic injuries, after applying the corresponding modulated reduction coefficients, yielded a 35% reduction in 2020 compared to 2010. Wong and Sze (2010) state that the year of reference set for targets is usually the year before its application.
Data
Data for severe traffic injuries used in this study are from the statistics published by the DGT (2015) and the population figures are from the Instituto Nacional de Estadística [National Statistics Institute] (2016) (19). According to Orden del Ministerio del Interior [Ministry of the Interior Order] INT/2223/2014, severe injuries are considered persons injured and hospitalized for over twenty-four hours, and as such are registered in the Registro Nacional de Víctimas de Accidentes de Tráfico [National Registry of Persons Injured in Accidents]. Starting in 2014, the DGT changed the term severe injuries to hospitalized injuries.
The types of road considered by the DGT for statistical purposes are motorway, expressway, highway, local road, service road, interchange ramp and other types. These are defined as:
- Motorway: controlled-access highway specially projected, constructed and indicated as such for the exclusive circulation of automobiles and having the following characteristics: no access to bordering properties, no at-grade crossing of pedestrian paths, roads, railway lines or trams, or crossed by at-grade pedestrian paths, communicating roads or any type of easement, and traffic in opposing directions separated, except at certain points or temporarily, by a median strip, or exceptionally by other means.
- Expressway: controlled-access highway specially projected, constructed and indicated as such with the following characteristics: limited access from bordering properties, no at-grade crossing of other pedestrian paths, road, railway or tram, nor at-grade crossing by pedestrian paths, connecting roads or easements, and traffic in opposing directions is separated, except at certain points or temporarily, by a median strip, or exceptionally by other means.
- Highway: a road which does not have the characteristics which define motorways, expressways and roads for automobiles.
- Local roads: roads belonging to a municipality which communicate towns and are useable by both pedestrians and vehicles.
- Service road: road parallel to another to which it is secondary, connected only at certain points to serve adjacent properties or buildings.
- Interchange ramp: connecting slip roads with one or several carriageways which allow continuous traffic between two others.
- Other: any other type of road not included above.
Method
The starting year for application of the methodology was taken as 2010. According to the Tolón-Becerra et al. (2009), methodology, reduction coefficients are expressed in relative terms of improvement as so much per one, which varies from 1 (theoretical case of starting total accident rates in the population) to 0 (hypothetical case in which the starting accident rate is zero).
The calculation methodology uses a nonlinear function through an inverse logarithmic distribution formula depending on the number of severe injuries per population relative indicator. For each application unit (i) in the methodology, whether territory or sector, the relative indicator (R) in reference year (2010) is:
where:
F = number of serious injuries
X = relativisation per population
The premises considered in the methodology are:

where:
c = total residual coefficient, complementary to the reduction coefficient, and according to the Spanish target, is equal to 0.65
F = summation of the number severe injuries in absolute values of each of the unitary areas Fi (sector: type of road, and geographic: Spanish provinces)
For each type of road and each province, a residual coefficient ci' is calculated as a function of the following inverse logarithmic distribution in the formula 2*.

Where a is the weighting factor modulating coefficient ci, found from the following expression:
This methodology was applied to each type of road and to each province.
Results of applying the methodology
The advances made in recent years by Spain in the field of road safety are positive, but a greater effort must be made to achieve the 35% reduction target set for the number of severe traffic injuries in 2011-2020.
For this, stronger efforts must be made where accident rates were higher in the starting year (2010) and where the trend was negative (increased accident rates) in recent years. By applying the methodology for calculating weighted reduction coefficients of the number of severe injuries in Spanish provinces, the target reduction in the number of severe injuries for 2020 was found for each.
Two targets were found for each province, one applying a general 35% reduction in severe injuries on all roads, and another applying reduction coefficients differentiated by type of road.
According to the formula applied, the total number of severe traffic injuries in absolute values in each province, is reduced heterogeneously, but in such a way that the total enables the Spanish 35% reduction target to be reached. Furthermore, the higher the indicator in the reference year (2010) for each of the provinces, the higher the reduction coefficient is.
Weighting by sector (type of road)
For each type of road, different reduction coefficients were found, such that those types of road where the most effort for reducing the accident rate made in the future is where there were the most severe injuries (SI) (table 2, page 284).
Table 2. Weighted reduction rates by road type.
Tabla 2. Valores objetivos de reducción ponderados por tipo de vía.

As observed in table 2, reductions higher than those set for Spain as a whole must be made on highways and other types of roads (including city streets). In the case of roads such as service roads or interchange ramps, the reductions proposed are low, because the premise is that a low accident rate in the starting year is related to a low reduction percentage in the target end year, which in this case is 2020.
Highway and Expressway usually are the main type of road for connection on rural areas, where a negative correlation between mortality rate and GDP is higher, whereas it is lower with population density (27).
Among the factors influencing rising road accidents in rural areas are the state of the vehicle pool, the state of the roads (in spite of investments made, many roads involve a higher traffic risk, mainly because of their location in mountainous areas), bad weather, and/or longer distance to medical centres, increasing the time required in emergencies (3). And they should be considered a priority area for improving road safety.
The methodology applied the total residual coefficient (c) found for each type of road for target distribution to the territories (Spanish provinces). The results found were compared to linear application of the Spanish target, a 35% reduction on all types of roads.
Weighting by territory
Avila, Cuenca and Soria, provinces with low population density, had the highest reduction percentages, similar to or over 50% (table 3, page 285) and therefore the highest reduction target.
Table 3. Reduction rates weighted as a function of serious injuries per 100 000 inhabitants.
Tabla 3. Valores objetivos de reducción ponderados en función de heridos graves por 100 000 habitantes.
The provinces with the most inhabitants (Madrid, Barcelona and Valencia) should reach reduction targets of about 30%, which although below the Spanish target, in absolute numbers of severe injuries, constitutes a significant reduction.
The mean reduction percentage is 36.1±8.9%. Furthermore, the high initial dispersion of the number of severe injuries per 100 000 inhabitants among the provinces is reduced considerably over time from a range of 9.4-80.3 to 8.7-41.8.
Weighting by territory and type of road
First, percentage reduction in the number of fatalities in 2020 was compared to 2010, both for linear sector application of the 35% severe injuries reduction target by type of road, and for nonlinear sector application as a function of the coefficients presented in Weighting by sector (type of road). Then the results found for the severe injuries by the type of road and per population indicators were analysed.
According to the statistical data for the starting year, not all the Spanish provinces had severe injuries, so it is assumed that in these provinces their accident rate statistics should remain at zero severe injuries.
The reduction percentages proposed for each province based on application of a reduction coefficient differentiated by type of road show similar general behaviour, with a mean reduction of 8.1 to 37.3%. For linear application of the reduction target to types of road, mean reductions were from 27.9 to 36.1%.
The highest dispersion in reduction percentages was observed for the types of road with the lowest number of provinces recording severe injuries (interchange ramps, local roads, service roads and motorways, with 19, 43, 13 and 25 provinces, respectively).
In general, more pressure for reduction is observed on those which had the worst results in the starting year (2010), confirming the premise that those geographic areas where severity of the social problem is the worst (severe injuries per population), must make the most effort.
Reduction percentages proposed for the number of severe injuries on motorways
Nine of the 25 provinces with victims must reduce the number of severe injuries on motorways by a percentage higher than the one set for Spain (35%), both in linear application and in application differentiated by type of road (table 4, page 286).
Table 4. Reduction rates weighted as a function of serious injuries per 100 000 inhabitants on motorways.
Tabla 4. Valores objetivos de reducción ponderados en función de heridos graves por 100 000 habitantes en autopistas.
These provinces are characterized by low population density. In Cuenca, Toledo, Malaga, Barcelona and Madrid, the reduction percentage was zero, because of the very low number of severe injuries per 100 000 inhabitants.
As a result, variation in the severe injuries rate per 100 000 inhabitants would go from a range of 0.1-5.6 in 2010 to 0.1-3.3 in 2020 (lineal application), or 0.1-3.9 (application by type of road).
Less pressure for reduction may be observed in application of the methodology to sector (type of road) with differences from linear application of 9.9 to 15.2 percentage points.
Reduction percentages proposed for number of severe injuries on expressways
On Spanish expressways, the reduction percentages varied from 14.8 to 46.0% for linear application of the reduction coefficient, and from 8.6 to 42.1% for application differentiated by type of road (sector), with the exception of La Rioja, Santa Cruz de Tenerife, Bizkaia and Barcelona which had a zero percent reduction due to the low rate of severe injuries per 100 000 inhabitants (table 5, page 287).
Table 5. Reduction rates weighted as a function of serious injuries per 100 000 inhabitants on expressways.
Tabla 5. Valores objetivos de reducción ponderados en función de heridos graves por 100 000 habitantes en autovías.
In general, the pressure for reduction decreases with sector application of the methodology, as in the case of motorways, due to the low general pressure that would be made on this type of road (30.3%).
The provinces with the highest number of severe injuries on expressways, Madrid, Valencia, Granada, Seville, Murcia, Cadiz and Toledo, which together represent 49% of injuries, had reduction percentages of 32.3 to 40.8% (linear application) and from 27.4 to 36.5% (sector application), where Madrid stands out with a lower reduction percentage than the one for Spain.
If the targets set for each province were met, the severe injury rate on expressways per 100 000 inhabitants would decrease from a range of 0.1-19.3 in 2010 to 0.1-11.3 in 2020 (linear application) or from 0.2 to 12.1 (sector application).
As shown for highways, the majority of provinces with a reduction percentage over the one for Spain are characterized mainly for a low population density; due a large proportion of their territories are rural areas.
Reduction percentages proposed for number of severe injuries on highways
The highest reduction percentage for highways was found with sector application by type of road (37.1%). And contrary to the two types of roads above, the reduction percentages were from 2.8 to 2.5 percentage points higher.
The results based on severe injuries on highways per 100 000 inhabitants, showed more uniform behaviour, with an average reduction percentage of 35.3±4.3% for linear application and 37.3±4.1% for sector application (table 6, page 288).
Table 6. Reduction rates weighted as a function of serious injuries per 100 000 inhabitants on highways.
Tabla 6. Valores objetivos de reducción ponderados en función de heridos graves por 100 000 habitantes en vías convencionales.
Less variation is due to the higher number of severe injuries on this type of road (49.5% in 2010), and therefore, the severe injury rate on highways per 100 000 inhabitants in the 51 provinces with injuries is higher than the rest of the cases included in the study.
The severe injury rate per 100 000 inhabitants would be reduced from a mean of 18.8±12.4 (2010) to 12.3±7.6 (2020 linear) or 11.9±7.4 (2020 sector). This would contribute significantly to Spain reaching the target set for 2011-2020 with a reduction in absolute values of 2,077 severe injuries for linear application or 2,199 severe injuries for sector application.
The importance of using both territorial and sector application of the Tolón- Becerra et al. (2009) methodology may be seen more clearly on this type of road.
Stronger pressure on sectors with more traffic accidents, in this case highways, will enable policymakers to focus more resources and stronger effort on this type of road, and in those provinces with the highest reduction percentages, such that Spain as a whole can reach its 35% reduction target in the number of severe injuries on roads. In addition, highways are located mainly in rural areas, so a stronger pressure should be applied on these territories.
Proposed reduction percentages for the number of severe injuries on local roads
The reduction percentages found for local roads with the linear application of the Spanish target had the second lowest average (28.7±14%) of the types of road.
With sector application, although the average reduction percentage went down (18.8±10.7%), it was still the third highest (table 7, page 289).
Table 7. Reduction rates weighted as a function of serious injuries per 100 000 inh. on local roads.
Tabla 7. Valores objetivos de reducción ponderados en función de heridos graves por 100 000 habitantes en caminos vecinales.

Like the other types of road analysed above, the provinces with the highest severe injuries per 100 000 inhabitants indicator had the highest reduction percentages. The indicator in the range of 0.1-6.0 was reduced to 0.1-3.5 (2020 linear) or to 0.2-4.1 (2020 sector) severe injuries per 100 000 inhabitants.
Reduction percentages proposed for the number of severe injuries on service roads
Severe injuries were lowest on service roads in 2010 (18) and also occurred in the fewest provinces compared to other types of roads (13).
After linear application of the methodology to all the types of roads in the Spanish reduction target, five of the 13 provinces with severe injuries had a reduction percentage higher than the one for Spain, but in practice, the reduction in injuries is one per province (Lugo, Cordoba, Bizkaia, Cadiz and Alicante).
In the remaining seven provinces, the low number of severe injuries (1) yielded zero percent reduction as a result.
When the methodology was applied to sectorize to the Spanish target by type of road, reduction percentages of zero percent were found for the 13 provinces. This was the result not only because of the low number of severe injuries in the starting year (2010), but also because of the high residual coefficient found for this type of road (c=0.97).
Reduction percentages proposed for the number of severe injuries on interchange ramps
Similar results were found for the reduction percentages on interchange ramps, since only seven of the 19 provinces where there were severe injuries had reduction percentages other than zero when the Spanish target was applied linearly. When the application was sectorized, only three provinces had reduction percentages.
Like the service roads, there were very few serious injuries on interchange ramps in 2010 (45), yielding as a result a high total residual coefficient (c=0.90) in sector application of the Spanish target, which yielded the results described above.
Reduction percentages proposed for the number of severe injuries on other types of road
The second highest number of severe injuries occurred on those considered "Other types of road" (table 8, page 290), and reduction percentages were found for 50 of the 51 provinces with severe injuries in 2010 as a result of the application of the methodology in this study.
Table 8. Reduction rates weighted as a function of serious injuries per 100 000 inhabitants on other types of road
Tabla 8. Valores objetivos de reducción ponderados en función de heridos graves por 100 000 habitantes en otro tipo de vía.
The mean reduction percentage was 30.1±8.1% for linear application and 30.8±8.1% for sector application, with dispersion similar to the one for total severe injuries on Spanish roads. Melilla, the autonomous city, stands out because in spite of its low number of severe injuries compared to the other provinces, it had the highest reduction percentages (42.1 and 42.7%). This is because of the high number of severe injuries per 100 000 inhabitants resulting from its small population.
The least differences were observed between the two applications of the methodology on this type of road due to the similar residual coefficient found for sector application (c=0.64).
Severe injury rates per population forecast for 2020
According to the results found for the total severe injuries per province and type of road, the original dispersion in severe injury rates per population among the provinces would be reduced even more over time, leading to convergence as observed in figure 3 (page 291).
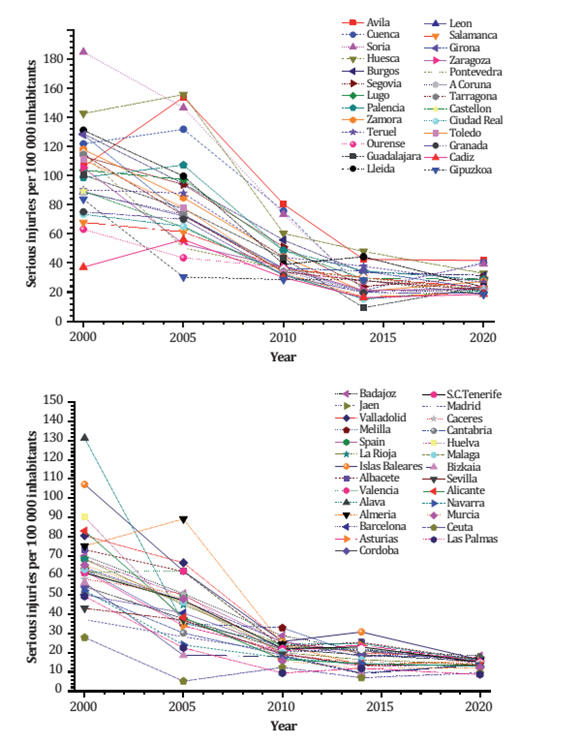
Figure 3. Evolution of serious injuries per 100 000 inhabitants in Spanish provinces in 2000-2014 and forecast for 2015-2020.
Figura 3. Evolución del número de heridos graves por 100 000 habitantes en las provincias españolas en el período 2000-2014 y previsión para 2015-2020.
In general, the mean and dispersion of values diminishes over time, especially due to the greater decrease in those areas which have high starting severe injury rates per population, as also shown by Wegman et al. (2005).
Variation in the severe injury rates per population go from a range of 27.9-184.8 (84.3±31.7) in 2000, to 5.3-155.7 (63.4±33.5) in 2005, 9.4-80.3 (32.5±15.7) in 2010, 7.1-48.0 (22.1±9.1) in 2014 and finally to 8.7-41.8 (20.3±7.5) in 2020, for total severe injuries in the Spanish provinces.
In 2014-2020, the reduction is smaller because of the effort made in the last few years, where stronger reductions are observed in those provinces with the highest severe injury rates per population. It should also be considered that the population trend for Spain and its provinces is negative, that is, a reduction in population is forecast for 2020.
A similar situation is observed on each type of road, with more real convergence in 2014, which would generally be maintained in 2020 based on the reduction percentages proposed. Like the total severe injuries on Spanish roads, the increases found in the severe injury rate per 100 000 inhabitants is due to the negative trend in population.
The most convergence was observed for highways, where 56% of severe injuries occurred in 2010, with variation in severe injury rates per population within a range of 0-150.7 (48.0±27.4) in 2000, 0-120.3 (38.6±26.8) in 2005, 0-55.8 (18.7±12.2) in 2010, 0-36.0 (10.3±6.8) in 2014 and finally 0-33.4 (11.9±7.4) in 2020 (sector application).
The reduction observed in the number of severe injuries from 2010 to 2014 was very positive, with severe injury rates per 100 000 inhabitants generally below those proposed in the study. This would show that policies applied in recent years have been positive for reducing traffic accident rates and that Spain as a whole could reach the target proposed for 2020.
A similar situation was observed for severe injuries in other types of roads, where the second highest number of severe injuries in Spain occurred (27% in 2010).
On expressways, where 10% of severe injuries occurred, the rates found were generally lower than in 2014. Therefore, stronger road safety policies are required for this type of road to reach the Spanish target.
The results for the different types of road highlight the need for a greater effort to be made by the provinces which have a worse starting situation. Based on the effort that these provinces make, greater convergence could be reached in the severe injury rate per population in 2020, and achieve more uniform road safety among the Spanish provinces. In addition, the proposed methodology could be extrapolated to other regions, such as Argentina or other Latin countries, where road accidents data could be analyzed and used to set road targets by regions and type of roads, in order to reach national road accidents reduction targets.
CONCLUSION
The results presented in this study seek to provide Spanish Policymakers with a wider vision on achievement of the Spanish road safety policy target by offering a variety of alternatives for sector and territory distribution of the target set for Spain. In this study, the methodology by Tolón-Becerra et al. (2013) was applied in two ways, on the territorial level by finding reduction targets for the number of severe injuries by province, and by sector, as a function of the type of road where the injuries occurred.
The various results found for each of the scenarios reinforces the need to sectorize and apply differentiated road safety policies in each of the territories, such that their application in the various regions that comprise Spain are adjusted to their intrinsic characteristics, mainly for rural areas where the factors influencing accidents rates differ from urban areas. Likewise, sectorized policies which in this study were the type of road where the traffic accident rates were caused, should be applied so that government action can focus its technical and economic efforts on those sectors with the least road safety. But all the territories and sectors as a whole must always contribute to the general target set, in this case a 35% reduction in severe injuries in Spain. This methodology can be applied in other regions, such as Argentina, where national efforts for reducing road accidents could be distributed among territories and sectors.
The results found tend to reduce the disparities in relative accident rates among provinces and to provide citizens with more uniform road safety throughout Spain. Not only a decrease in the mean number of severe injuries per population is proposed, but also of the variation existing among provinces and by type of road.
Application of the methodology using severe injuries per kilometre road as a relative indicator would enable more realistic targets to be found since this indicator would make a better analysis of traffic accident rates possible. But the data per kilometre by type of road and province are not available from official agencies, a situation which should be improved to provide researchers and policymakers with more information for decision-making on road safety.
1. Aarts, L. T.; Houwing, S. 2015. Benchmarking road safety performance by grouping local territories: A study in the Netherlands. Transportation Research Part A: Policy and Practice Articles. 74: 174-185. [ Links ]
2. Berg, H. Y.; Ifver, J.; Hasselberg, M. 2016. Public health consequences of road traffic injuries-Estimation of seriously injured persons based on risk for permanent medical impairment. Transportation Research Part F: Traffic Psychology and Behaviour. 38: 1-6. [ Links ]
3. Clark, D. E.; Cushing, B. M. 2004. Rural and urban traffic fatalities, vehicle miles, and population density. Accident Analysis Prevention. 36: 967-972. [ Links ]
4. Dirección General de Tráfico (DGT). 2011. Estrategia de Seguridad Vial 2011-2020. Dirección General de Tráfico. Madrid. 237 p. [ Links ]
5. Dirección General de Tráfico (DGT). 2015. Anuario estadístico de accidentes 2014. Ministerio del Interior, Dirección General de Tráfico. 194 p. [ Links ]
6. Eksler, V. 2010. Measuring and understanding road safety performance at local territorial level. Safety Science. 48 (9): 1197-1202. [ Links ]
7. Eksler, V.; Lassarre, S.; Thomas, I. 2008. Regional analysis of road mortality in Europe. Journal of the Royal Institute of Public Health. 122: 826-837. [ Links ]
8. Eksler, V.; Lassarre, S. 2008. Evolution of road risk disparities at small-scale level: example of Belgium. Journal of Safety Research: 39 (4): 417-427. [ Links ]
9. Elvik, R. 1993. Quantified road safety targets: A useful tool for policy making? Accident Analysis and Prevention. 25 (5): 569-583. [ Links ]
10. Elvik, R. 2008. Road Safety management by objectives: A critical analysis of the Norwegian approach. Accident Analysis and Prevention. 40: 1115-1122. [ Links ]
11. Elvik, R. 2010. Strengthening incentives for efficient road safety policy priorities: The roles of cost–benefit analysis and road pricing. Safety Science. 48: 1189-1196.
12. European Commission (EC). 2010. Communication from the Commission to the European Parliament, the Council, the European Economic and Social Committee and the Committee of the Regions. Towards a European road safety area: policy orientations on road safety 2011-2020. COM(2010) 389 final. Brussels. Disponible en: http://eurlex.europa.eu/legal-content/EN/TXT/?uri=celex:52010DC0389 (fecha de consulta: 10/10/2016) Global Road Safety Partnership. 2008. Speed management: a road safety manual for decision-makers and practitioners. Geneva. 196p. [ Links ]
13. Hermans, E.; Brijs, T.; Wets, G. 2008. Developing a theoretical framework for road safety performance indicators and a methodology for creating a performance index. Steunpunt mobiliteit en openbare werken-spoor verkeersveiligheid. 85 p. [ Links ]
14. Hermans, E.; Brijs, T.; Wets, G.; Vanhoof, K. 2009. Benchmarking road safety: Lessons to learn from a data envelopment analysis. Accident Analysis and Prevention. 41: 174-182. [ Links ]
15. Holló, P.; Eksler, V.; Zukowska, J. 2010. Road safety performance indicators and their explanatory value: A critical view based on the experience of Central European countries. Safety Science. 48: 1142-1150. [ Links ]
16. Hughes, B. P.; Anund, A.; Falkmer, T. 2015. System theory and safety models in Swedish, UK, Dutchand, Australian road safety strategies. Accident Analysis and Prevention. 74: 271-278. [ Links ]
17. Instituto Nacional de Estadística. 2016. Cifras de población y Censos demográficos. Disponible en: http://www.ine.es/censos2011_datos/cen11_datos_inicio.htm (fecha de consulta: 10/10/2016). [ Links ]
18. Johnston, I. R. 2006. Highway safety. In: Fwa, T. F. (Ed.), The Handbook of Highway Engineering. Taylor and Francis. New York. [ Links ]
19. Johnston, I. 2010. Beyond "best practice" road safety thinking and systems management - A case for culture change research. Safety Science. 48: 1175-1181. [ Links ]
20. Loo, B. P. Y.; Hung, W. T.; Lo, H. K.; Wong, S. C. 2005. Road safety strategies: a comparative framework and case studies. Transport Reviews. 25: 613-639. [ Links ]
21. Orden INT/2223/2014, de 27 de octubre, por la que se regula la comunicación de la información al Registro Nacional de Víctimas de Accidentes de Tráfico. Disponible en: https://www. boe.es/diario_boe/txt.php?id=BOE-A-2014-12411 (fecha de consulta: 10/10/2016). [ Links ]
22. Shen, Y.; Hermans, E.; Bao, Q.; Brijs, T.; Wets, G. 2015. Serious Injuries: An additional indicator to fatalities for road safety benchmarking. Traffic Injury Prevention. 16 (3): 246-253. [ Links ]
23. Sze, N. N.; Wong, S. C.; Lee, C. Y. 2014. The likelihood of achieving quantified road safety targets: A binary logistic regression model for possible factors. Accident Analysis and Prevention. 73: 242-251. [ Links ]
24. Theofilatos, A.; Yannis, G. 2014. A review of the effect of traffic and weather characteristics on road safety. Accident Analysis and Prevention. 72: 244-256. [ Links ]
25. Tolón-Becerra, A.; Lastra-Bravo, X.; Bienvenido-Bárcena, F. 2009. Proposal for territorial distribution of the 2010 EU road safety target. Accident Analysis and Prevention. 41: 1008-1015. [ Links ]
26. Tolón-Becerra, A.; Lastra-Bravo, X.; Flores-Parra, I. 2013. National and regional analysis of road accidents in Spain. Traffic Injury Prevention. 14 (5): 486-95. [ Links ]
27. Townsend, E.; Avenoso, A. 2008. "Road Safety as a right and responsibility for all" A Blueprint for the EU's 4th Road Safety Action Programme 2010-2020. European Transport Safety Council. Brussels. [ Links ]
28. Trinca, G. W.; Johnston, I. R.; Campbell, B. J.; Haight, F. A.; Knight, P. R.; Mackay, G. M.; McLean, A. J.; Petrucelli, E. 1988. In: Reducing Traffic Injury -A Global Challenge. Royal Australasian College of Surgeons. Melbourne. [ Links ]
29. Wegman, F.; Eksler, S.; Hayes, S.; Lynam, D.; Morsink, P.; Oppe, S. 2005. SUNflower+6: A comparative study of the development of road safety in European countries. SWOV, Final Report. Leidschendam. 83 p. [ Links ]
30. Wegman, F.; Aarts, l.; Bax, C. 2008. Advancing sustainable safety National road safety outlook for The Netherlands for 2005-2020. Safety Science. 46: 323-343. [ Links ]
31. Wegman, F.; Oppe, S. 2010. Benchmarking road safety performances of countries. Safety Science. 48: 1203-1211. [ Links ]
32. Weijermars, W.; Bos, N.; Stipdonk, H. L. 2016a. Health burden of serious road injuries in the Netherlands. Traffic Injury Prevention. 17 (8): 863-869. [ Links ]
33. Weijermars, W.; Bos, N.; Stipdonk, H. L. 2016b. Serious road injuries in The Netherlands dissected. Traffic Injury Prevention. 17 (1): 73-79. [ Links ]
34. Wesemann, P.; van Norden, Y.; Stipdonk, H. 2010. An outlook on Dutch road safety in 2020; future developments of exposure, crashes and policy. Safety Science. 48: 1098-1105. [ Links ]
35. Wong, S. C.; Sze, N. N. 2010. Is the effect of quantified road safety targets sustainable? Safety Science. 48: 1182-1188. [ Links ]
36. Wong, S. C.; Sze, N. N.; Yip, H. F.; Loo, B. P. Y.; Hung, W. T.; Lo, H. J. 2006. Association between setting road safety targets and road fatality reduction. Accident Analysis and Prevention. 38: 997-1005. [ Links ]
37. Yannis, G.; Papadimitriou, E.; Antoniou, C. 2008. Impact of enforcement on traffic accidents and fatalities: A multivariate multilevel analysis. Safety Science. 46: 738-750. [ Links ]
38. Zwerling, C.; Peek-Asa, C; Whitten, P. S.; Choi, S-W.; Sprince, N. L.; Jones, M. P. 2005. Fatal motor vehicle crashes in rural and urban areas: decomposing rates into contributing factors. Injury Prevention. 11: 24-28. [ Links ]
ACKNOWLEDGEMENTS
This work was supported by grants from the Spanish Ministerio de Economía y Competitividad (MINECO) and European Regional Development Fund (ERDF), Project CTM 2013-41750-P: "Territorial and sector target distribution model for evaluating sustainability using indicators".

