


Servicios Personalizados
Revista

Articulo
 Inglés (pdf)
 Articulo en XML
 Referencias del artículo
 Enviar articulo por email
Indicadores
-
 Citado por SciELO
Links relacionados
-
 Similares en
SciELO
Similares en
SciELO
Compartir

 Permalink
Revista de la Facultad de Ciencias Agrarias. Universidad Nacional de Cuyo
versión impresa ISSN 1853-8665versión On-line ISSN 1853-8665
Rev. Fac. Cienc. Agrar., Univ. Nac. Cuyo vol.51 no.2 Mendoza dic. 2019
ORIGINAL ARTICLE
Actual evapotranspiration and the pattern of soil water extraction of a soybean (Glycine max) crop
Evapotranspiración real y patrones de extracción de agua del suelo de un cultivo de soja (Glycine max)
Lucía Curto 1, 2*, Mauro Covi 1, María Isabel Gassmann 1, 2
1 Universidad de Buenos Aires. Facultad de Ciencias Exactas y Naturales. Departamento de Ciencias de la Atmósfera y los Océanos. Intendente Güiraldes 2160, Ciudad Universitaria. Ciudad Autónoma de Buenos Aires. Argentina. (C1428EGA). * curtolucia@gmail.com
2 Consejo Nacional de Investigaciones Científicas y Técnicas (CONICET). Godoy Cruz 2290. Ciudad Autónoma de Buenos Aires. Argentina (C1425FQB).
Originales: Recepción: 05/11/2018 - Aceptación: 15/08/2019
ABSTRACT
Crop evapotranspiration knowledge during different phenological stages helps determine crop water requirements and water use efficiency. This study was intended to estimate evapotranspiration of soybean grown under field conditions using the water balance equation and to characterize root water extraction across different soil layers analyzing daily values of its availability. In order to estimate the crop daily water consumption, temporal and spatial variability (vertical) of soil water content up to a depth of 1.10 m was investigated. At the beginning of the experiment, measurements showed that the soybean crop extracted water from the upper levels, and as it continued to grow, water uptake at deeper levels increased. The highest water uptake occurred during reproductive growth stages, which matched the period of highest atmospheric demand. The crop showed a better response to atmospheric demand under water availability, whereas under stress conditions, both evapotranspiration and soil water content decreased.
Keywords: Soil water balance; Rainfed; Argentina; Water stress; Water uptake; Soybean
RESUMEN
Conocer la evapotranspiración de un cultivo durante sus distintos estadios fenológicos ayuda a determinar los requerimientos de agua del mismo y la eficiencia del uso de agua. Los objetivos de este trabajo fueron estimar la evapotranspiración de un cultivo de soja desarrollado bajo condiciones de campo, utilizando la ecuación de balance hídrico, y caracterizar la extracción de agua por parte de las raíces en las distintas capas del suelo, analizando los valores diarios de su disponibilidad. Para determinar los consumos diarios del cultivo se estudió la variabilidad temporal y vertical del contenido de agua en el suelo hasta 1.10 m de profundidad. Al comienzo de las mediciones, el cultivo de soja extrajo agua de los niveles superiores, y a medida que se desarrollaba, aumentó el consumo en niveles más profundos. El mayor consumo de las plantas se dio en los estadios reproductivos, coincidiendo con el período de mayor demanda atmosférica. El cultivo mostró una mejor respuesta a la demanda atmosférica bajo la disponibilidad de agua, mientras que, en condiciones de estrés, tanto la evapotranspiración como el contenido de agua en el suelo disminuyeron.
Palabras clave: Balance de agua en el suelo; Secano; Argentina; Estrés hídrico; Consumo de agua; Soja
INTRODUCTION
The high growth rates of global population demand a substantial increase of food production. Soybean is one of the most important crops in terms of production, worldwide trade and harvested area (35). Argentine soybean harvested area has grown at an average rate of 7.3 x 10⁵ ha/year from 1997 to 2016 which leads to 1.95 x 10⁷ ha and 5.88 x 10⁷ t in 2016 (21). The increased demand of agricultural food production requires a clever analysis of water needs over the crop cycle to ensure its maximum efficiency (36). Significant importance has been given to studies on evapotranspiration at different phenological stages, particularly in critical periods of yield determination (3, 15, 20, 46). These researches allow quantifying, under different management conditions, the amount of crop irrigation water needed to achieve optimal growth or the expected yield loss (10, 29).
Soil water balance is a method used for the estimation of actual evapotranspiration (ETa) which considers the water balance within the soil depth explored by plant roots, and analyzes only the vertical components of water movements (26). Though this is not the method recommended by FAO (2006) for evapotranspiration estimation, it has virtually no restrictions for use. Besides, it facilitates decision-making on water management, since production in Argentina is mostly under rainfed agricultural systems (34). The use of this methodology requires rainfall and soil moisture measurements at appropriate scales in space and time. Soil moisture, the most difficult of both variables to measure, is critical for the evolution of meteorological variables, as its controls the water and energy exchanged by a surface with the atmosphere (23, 26).
The study on soil water extraction patterns (WEP) is used to obtain information about the spatial and temporal plant water consumption variability. Plant water uptake is affected by soil texture and vertical root distribution (5, 43). However, these authors (32) consider learning of WEPs is more useful than observing root density. Some researches focuses on the vertical distribution of water extraction in the soil profile (2, 5, 11), while others analyze temporal rate of water extraction (7, 14, 31, 38, 43).
Most water-extraction studies were performed in experimental plots or in the laboratory in controlled environments (39), which can hardly represent real field conditions. There is a gap between actual yields obtained by growers and the potential yield of the best-adapted crop varieties, under good management conditions and in absence of biotic and abiotic stresses (24). It is therefore important to record in productive plots the evolution of variables that are usually measured in controlled experiments, considering that their behavior should not change. Therefore, the objectives of this research are: (a) to learn of the daily ETa in a field soybean plot, its variability compared to crop evapotranspiration under standard conditions, and its correlation to other meteorological variables, and (b) to study WEPs in order to investigate the relative contribution to ETa of each soil layer.
MATERIALS AND METHODS
Sampling site and data collection
The study was carried out in the Unidad Integrada Balcarce [Unidad Integrada Balcarce] (UIB, Facultad de Ciencias Agrarias de la Universidad Nacional de Mar del Plata - Estación Experimental Agropecuaria Balcarce del Instituto Nacional de Tecnología Agropecuaria), located in the southeast of the Province of Buenos Aires. (37°45' S; 58°18' W), Argentina. The meteorological and edaphic variables need to estimate crop evapotranspiration were measured in a 19-ha soybean plot during the 2012-2013 summer season. The soil is classified as a typical Argiudoll, with a loamy clayey texture up to 0.30 m depth and between 0.80 to 1.10 m, and clayey between 0.30 and 0.80 m depth (41). The land has a slope of 1:50 oriented NE to SW. A caliche layer was found at 1.00 m to 1.20 m depth and the water table was considered to be beneath that level. The soybean variety used was DM 3810, Maturity Group III with indeterminate growth habit. The crop was sown on November 21, 2012, and emergence occurred on December 1. The crop was grown under rainfed conditions. Soy growing stages were identified on a weekly basis following phenological scale from these authors (22), the evolution of which is shown in table 1 (page 128).
Table 1. Soybean Phenological Stages (21). Most significant events and dates are shown.
Tabla 1. Estadios fenológicos de soja (21). Se indican los eventos más significativos y las fechas de ocurrencia respectivas.

The information used in this study included daily precipitation records and reference crop evapotranspiration (ET0) estimated for the 2013 January-March period at the INTA-Balcarce Estación Experimental, located about 1 km away from the experimental site.
A database resulting from soil water content (SWC) readings measured with an array of Sentek EnviroSCAN capacitive sensors (Sentek Sensor Technologies, Stepney, Australia), and a Troxler neutron probe Model 4300 Depth Moisture Gauge (Troxler Electronics Laboratories Inc., Research Triangle Park, USA) was previously presented (12).
The vertical spatial resolution of the database was a depth range of 0.01 m to 1.10 m and the temporal resolution was 15 minutes. The study period started on January 6 and ended on March 15, 2013 (69 days, phenological stages V3 to R5, table 1).
Methodology
Water balance within a soil thickness in a time interval Δt is expressed as Hiilel (1998):
SWCt= SWCt-Δt+ PPt- ETt- Pert- R t (1)
where:
SWCt and SWCt-Δt = the soil water content measured at time points t and t-Δt, respectively
PPt = precipitation
ETt = evapotranspiration
Pert = deep percolation
R t = surface runoff, all of them for time t
Soil water content, precipitation, percolation and runoff measurements can be used to estimate soil water loss to the atmosphere by evapotranspiration, clearing this variable from Equation (1) and integrating at successive time intervals. Equation (1) could include other terms, which were not considered in this work such as irrigation, horizontal flow of water in soil and water movement from water table through capillary rise due to the fact that the crop grows under rainfed conditions, and the contributions of water horizontal fluxes and capillarity are neglegible.
For the estimation of SWC, high-resolution humidity profiles interpolated at 12:00 UTC (9:00 local time) were selected to coincide with the time at which precipitation was measured. This data was considered day-representative. A 24 h time interval (Δt) was used. Estimation of SWC for the soil profile ([0;1.1m]) was done by numerical integration of soil moisture profiles using the trapezoidal rule and expressing the result as water depth units (mm). Using the same methodology, the field capacity (FC) and permanent wilting point (PWP) values from this author (6) were integrated for the soil profile to estimate the available water (AW) (13).
In order to characterize soil water variability across different layers, four regular partitions were taken from the profile: 0-0.275, 0.275-0.55, 0.55-0.825 and 0.825-1.10 m. Partitions do not match with the soil stratigraphy (12). Soil water content (SWCk) and soil water availability (AWk) series for each layer were obtained using the same method as for the entire profile with the information in table 2 (page 130).
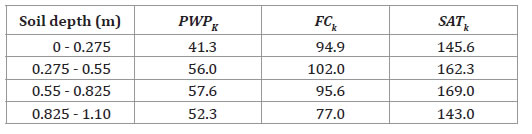
Table 2. Field Capacity (FCk), Permanent Wilting Point (PWPk) and Saturation Point (SATk) expressed as depth of water (mm) for Balcarce at different soil depths (6, 39). Variables are expressed in average values for the defined layers.
Tabla 2. Capacidad de campo (CCk), punto de marchitez permanente (PMPk) y punto de saturación (SATk) expresados como lámina de agua (mm) para la localidad de Balcarce a distintas profundidades (6, 39). Los valores de las variables son promedios para las capas definidas.
Decline in SWCk was used to detect plant water uptake while increases were associated to water inflow. These values were integrated on a daily basis and for the V3-V8, R1-R2 and R3-R4 crop growth periods (table 1, page 128). Additionally, the percentage share contributed by each layer to the total water consumption, previously defined as WEP, was estimated. Also, average daily consumption was assessed for each individual level at the phenological periods mentioned before.
For the estimation of ETa, Equation 1, (page 128), was solved for the total soil profile considering the SWC value integrated up to 1.10 m (SWC0-1.10 m). No estimations of surface runoff were done. Deep percolation and capillary rise from the water table were neglected due to their low incidence in the soil water balance. On days with precipitation, evapotranspiration was not estimated since temporal scales of processes represented by each term of Equation 1 (page 128), are different (37). The days in which an increase in SWC0-1.10 mwas found without previous rainfall record were also excluded.
A regression analysis between ETa, crop evapotranspiration under standard conditions (ETc) and SWC0-1.10 was carried out in order to characterize the dominant drivers of actual evapotranspiration. Crop evapotranspiration under standard conditions was estimated as ETc = Kc ET0, where Kc is the crop coefficient (1). Kc values were obtained using the empirical equation developed by these authors (17) for soybean grown in Balcarce:
Kc = 2.30 x10⁻⁸(DAE)4-7.29x10⁻⁶(DAE)3+ 5.62 x 10⁻⁴(DAE)2+4.93x10⁻⁵(DAE)+0.32 (2)
where:
DAE = days after emergence
Water stress was studied for those cases where ETa resulted lower than ETc.
The Mann-Whitney U Test (9) was used to determine whether the crop was under water stress and to identify periods where plants suffered stress. SWC - ETa/ETc pairs were ordered by increasing magnitude of SWC. By using increasing SWC thresholds, the data set was divided into two groups that were sequentially tested to find the threshold value that best represented the difference between the two groups.
RESULTS AND DISCUSSION
Soil water content
Measurements showed from the beginning a decreasing SWC0-1.10 m (figure 1a, page 130), with occasional increases associated to precipitation events.
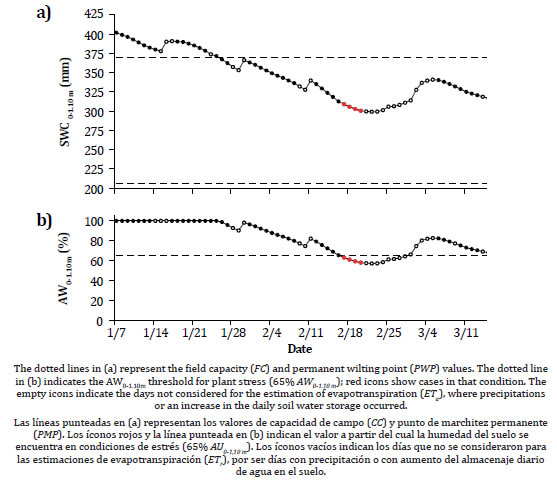
Figure 1. Water Content Evolution (SWC0-1.10 m; a) and soil water availability (AW0-1.10 m; b), integrated for each date in the entire soil profile.
Figura 1. Evolución del contenido de agua (CAS0-1.10 m; a) y porcentaje de agua útil (AU0-1.10 m; b), integrado para cada fecha en el total del perfil del suelo.
At the early stages of senescence, this general decreasing trend reverted as a result of the gradual decrease of crop water uptake and the occurrence of long-duration precipitation events. The soil water content measured up to 1.10m depth was always higher than PWP, which was estimated at 206 mm.
At the beginning of the study period (January 6 through 25), SWC0-1.10 m was above field capacity (369 mm; figure 1a, page 130). Its distribution in the profile showed that the largest soil water storage occurred at the 0.275 - 0.825 m depth range (SWC0.275-0.55 m and SWC0.55-0.825 m, figure 2a, page 131 and table 2, page 130) reaching in some cases more than 100% AWk for both levels (figure 2b, page 131) and for the entire profile (AW0-1.10 m; figure 1b, page 130).
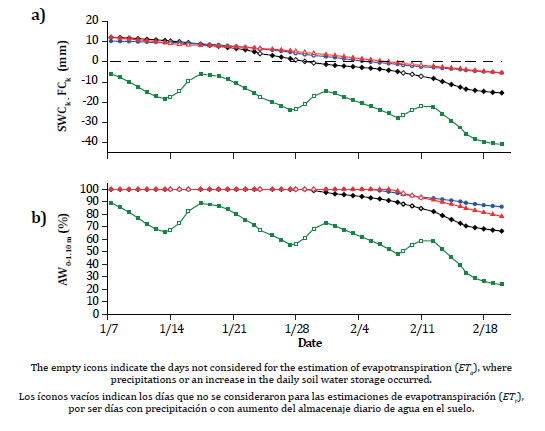
Figure 2. Difference between the soil water content and the field capacity value (SWCk,- FCk; a) and soil water availability (AWk; b) for the 0-0.275 (green squares), 0.275-0.55 (black diamonds), 0.55-0.825 (blue circles) and 0.825-1.10 m (red triangles) layers.
Figura 2. Diferencia entre el contenido de agua en el suelo y el valor de capacidad de campo (CASk,- CCk; a) y del porcentaje de agua útil (AUk; b) para los estratos de 0-0,275 (cuadrados verdes), 0,275-0,55 (rombos negros), 0,55-0,825 (círculos azules) y 0,825- 1,10 m (triángulos rojos).
A number of edaphic, biological and meteorological factors can explain this behavior. In the first place, precipitation in December was 239.9 mm, which included heavy rainfall events on December 19 and 24 (77 mm and 88 mm, respectively).
In addition, precipitation recorded on January 1 and 5 was 26.5 mm and 20 mm, respectively. Secondly, there is an assumption of shallow rooting during the heavy precipitation period (31, 43) because crop emergence occurred in the early days of December.
Lastly, the presence of clay in the intermediate soil layers (41) and caliche in the lower levels may have slowed down water movement and reduced percolation to deeper levels. These factors could prevent precipitation from rapidly flowing out of the system by percolation or evapotranspiration.
Actual Evapotranspiration
ETa increased gradually to reach a maximum value between February 12 and 15, and then decreased (figure 3, page 133).

Figure 3. Soybean crop evapotranspiration under standard conditions (ETc, dotted line), actual evapotranspiration (ETa, solid line) and precipitation (grey bars).
Figura 3. Evapotranspiración de un cultivo de soja bajo condiciones estándar (ETM, línea punteada), evapotranspiración real (ETr, línea llena) y precipitación (barras grises).
The highest estimated value was 5.9 mm/day on February 13. The highest ETc value recorded for soybean was 6.8 mm/day on February 15 (77 DAE). This result is similar to that obtained by these authors: Della Maggiora et al. (2000), for a soybean crop in Balcarce of approximately 7 mm/day 70 DAE. The mean and median ETa values for the complete period were both at 3.0 mm/day, with a standard deviation of 1.2 mm/day and an interquartile range of 1.3 mm/day.
ETa was always lower than ETc, even during the periods when AW0-1.10m was 100%, which suggests that there has been another factor limiting evapotranspiration other than water availability. The dry biomass value for the V3/V4 stage was 308 kg/ha, with a row spacing of 0.38 m and a plant density of 383000 plants/ha. For a soybean crop, at the same development stage and in the same region, under controlled water conditions and without limitations, Della Maggiora et al. (2006), obtained 324 kg/ha with a row spacing of 0.70 m and plant densities between 240000 and 309000 plants/ha. But Andriani et al. (1991) found values above 500 kg/ha in rainfed conditions with a row spacing of 0.70 m and plant densities between 270000 y 330000 plants/ha. This information confirmed that the crop growth rate declined during the growing season. It failed to achieve complete coverage thus limiting the evapotranspiration.
The results for the different phenological stages show that the SWC0-1.10m value decreased to a rate of about 5.5 mm/day until February 21 (figure 1a, page 130), whereas ETa and ETc increased until February 13 and 15, respectively. Until then, the crop developed from the V3 stage up to pod formation at R3, passing through the flowering stage (table 1, page 128). As already mentioned, the high water requirements of plants at these stages plus the increased atmospheric demand (table 3, page 134) contributed to a higher evapotranspiration causing therefore a reduction in soil water content.
Table 3. Actual Crop Evapotranspiration (ETa), Reference Crop Evapotranspiration (ET0) and soybean crop evapotranspiration under standard conditions (ETc), average (mm/day) and accumulated (mm) for Balcarce, for each phenological period.
Tabla 3. Evapotranspiración real del cultivo (ETr), evapotranspiración de cultivo de referencia (ET0) y evapotranspiración para un cultivo de soja bajo condiciones estándar (ETM) promedio (mm/día) y acumulada (mm) para la localidad de Balcarce, para cada período fenológico.

Grain filling at R5 started on February 22. At this stage, plants start to translocate nutrients to the pods in formation (40) and senescence starts. As of this moment, ETa and ETc started to decrease (figure 3, page 133), and as a result of the 63 mm rainfall between February 25 and March 7, SWC0-1.10m increased (figure 1, page 130).
ETa values obtained from Equation 1 (page 128), showed a better correlation with ETc (r2=0.62, p<0.01; figure 4a, page 135) than with ET0 (r2=0.43, p<0.01).

Figure 4. Actual Evapotranspiration (ETa) as a function of soybean crop evapotranspiration under standard conditions (ETc) (mm/day; a) with its linear least squares adjustment (ETa = 0.70 ETc - 0.23 mm, r2 = 0.62, p < 0.01). ETa/ETc, ratio as a function of soil water content for the 0-1.10 m soil thickness (SWC0-1.10m, mm; b) with its linear regression (ETa/ETc = -0.001 mm-1 SWC0-1.10m + 1.19, r2 = 0.07, p > 0.16).
Figura 4. Evapotranspiración real (ETr) en función de la evapotranspiración de un cultivo de soja bajo condiciones estándar (ETM) (mm/día; a) con su respectivo ajuste lineal por cuadrados mínimos (ETr=0,70 ETM - 0,23 mm, r2 = 0,62, p < 0,01). Cociente entre ETr y ETM, en función del contenido de agua en el suelo para el espesor de suelo 0-1,10 m (CAS0-1,10 m, mm; b) con su respectiva regresión lineal (ETr/ETM = -0,001 mm-1 CAS0-1,10 m + 1,19, r2 = 0,07, p > 0,16).
This is an indication that the Kc coefficient, which summarizes the evolution of crop characteristics, had a significant impact on the results.
Mechanisms controlling the relationship between evapotranspiration and water availability in the soybean crop can be diverse. The most important one is associated with the stomatal regulation, controlled by hormone signals coming from the roots and by leaf turgor loss (11, 30, 45).
Some authors suggest an effect resulting from the reduction of soil hydraulic conductivity associated to drying, particularly in clayey soils with high impedance to water flow (19, 38, 39). An additional difficulty for water extraction in this type of soils is associated to root clumping (14). It has also been suggested that there is another effect associated to root contraction caused by drying, which increases the resistance to water flow in the soil-root interface (44).
In association to these mechanisms, the behavior usually found in some evapotranspiration and soil moisture variables is a process regulated by a limiting factor (8, 27, 33, 42). However, in other studies (7, 14, 19) there is no clear evidence of this kind of response.
According to the proposed method, the threshold value established for water stress of SWC0-1.10 m= 312 mm was used to identify groups with p < 0.01. This threshold value correlates to an approximate AW0-1.10 m value of 65%, and a mean matric potential for the soil moisture profile of -1.4 MPa, as per retention curves from these authors (18). The data set for water stress included findings of four consecutive days (February 17-20, around R4 stage), during which SWC0-1.10m and ETa/ETc decreased simultaneously (red dots in figure 1 (page 130), figure 3 (page 133) and figure 4b (page 135).
Functional dependence was not studied in this case because there were not enough available data. Other authors found similar behaviors. These authors (8) detected reduced evapotranspiration in soybean with AW values below 48% to 36%, while these others (33) found similar results but only with AW values below 25%. These authors (27) found a decrease in evapotranspiration for pre-dawn plant water potential values of -0.33 MPa. A study aimed at modelling water deficit in Balcarce (15) used AW thresholds of 60% for the three decades (10-day periods) of flowering, and 40% for the rest of the cycle. These authors (14) established an AW threshold of 62%, and a pre-dawn water potential of -1.4 MPa for the same location, with results similar to those obtained in this study.
However, the different methods used to define FC, PWP (42), the differences found between different types of soils and evapotranspiration references used in the different studies make comparison of results difficult.
Under no-stress conditions (black, grey and empty dots in figure 4b (page 135), Ea/ETc showed no significant dependence on SWC0-1.10m, and presented high variability (a median of 0.62, interquartile range of 0.22). These authors (7, 45) found a relative reduction in ETa under potential and high demand conditions, while these others (19) did not find a similar response. Results seem to indicate that the atmospheric demand had no impact on the Ea/ETc ratio, as represented by the distribution of black, grey and empty dots (terciles of ET0) in figure 4b, page 135.
Other possible sources of evapotranspiration variability that have not been analyzed can be water balance components not considered in this study, such as surface or subsurface runoff (associated to land slope), deep percolation and ponding. In this regard, an increased SWC0-1.10m was found in days without precipitation (a total of 12 days between January 7 and March 15, with a median increase value of 1.4 mm and interquartile range of 1.4 mm), which could be associated to ponding or horizontal water movement phenomena. These were not taken into account for ETa estimations.
Water Extraction Patterns (WEP)
Considering the net consumption per level over the different phenological stages, the upper layer (0-0.275 m) is where the crop met most of its water needs (figure 5a, page 137).
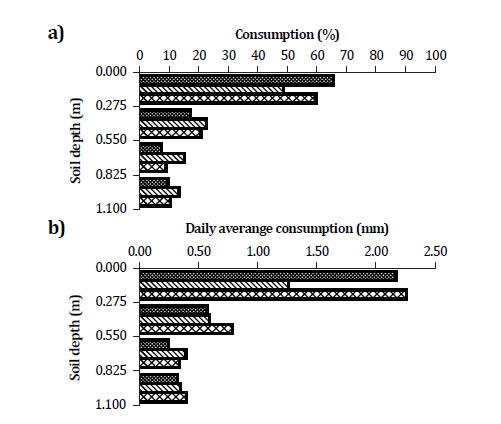
Figure 5. (a) Individual layer share of total water consumption (%) and (b) daily average consumption (mm) in each layer, for V3-V8 (dense grid pattern), R1-R2 (striped pattern) and R3-R4 (spaced grid pattern) phenological periods.
Figura 5. (a) Contribución de cada capa al consumo total de agua (%) y (b) consumo medio diario (mm) de cada capa, para los períodos fenológicos V3-V8 (patrón cuadriculado denso), R1-R2 (patrón a rayas) y R3-R4 (patrón cuadriculado espaciado).
The third and fourth layer contributed alternately with smaller amounts of water at different crop phenological stages: 0.55-0.825 m at V3-V8 and R3-R4, and 0.825-1.10 m at R1-R2. It was also found that the vertical profile of water consumption (%) for the vegetative phases was less homogeneous (highest consumption in the first stage), while water uptake was more equally distributed among layers during R1-R2. This might be an indication that, as there is less root development at the beginning of stage V, the crop restricted water extraction to upper levels.
Then, with an increased root development at R1-R2, and with less water content in the surface layer, the relative contribution of deeper layers increased.
At R3-R4, water consumption by the crop increased as a result of a higher atmospheric demand (table 3, page 134) and because the crop was passing through phenological stages in which there is a high demand of water (16). Water use values for this stage were the highest of the three stages under study (figure 5b, page 137).
However, consumption percentage increases again in the upper soil level (figure 5a, page 137). As the top soil layer is recharged (figure 4, page 135; 10/2), roots will take up water again from that layer regardless of the moisture in deeper levels (28). Vertical distribution of WEP values were in general similar to those found by these authors (25) for the two-year trial on soybean under irrigation in the same location, where most of the water supply came from the upper soil layer.
The water stress event occurred at the end of R3-R4. It consisted in a reduction of water storage, which was reflected in a lower AWk value even in the two deepest levels (figure 2, page 131), which can be associated to a dominant effect of water extraction by plants (43).
From February 17 to 20, the crop gradually extracted a higher volume of water from deeper soil layers (figure 6), as moisture decreased in the surface layer.

Figure 6. Individual layer share of total water consumption (%) 0-0.275 (spaced striped pattern), 0.275-0.55 (spaced grid pattern), 0.55-0.825 (dense striped pattern) and 0.825-1.10 m (dense grid pattern) strata, for February 12 to 20, which includes the water stress period.
Figura 6. Contribución de cada capa al consumo total de agua (%) para los estratos de 0-0,275 (patrón rayado espaciado), 0,275-0,55 (patrón cuadriculado espaciado), 0,55-0,825 (patrón rayado denso) y 0,825-1,10 m (patrón cuadriculado denso), para los días 12 al 20/2, que incluyen el período en que el cultivo de soja sufrió estrés hídrico.
Other authors (2, 4, 11) also reported that higher water extraction records moved to deeper soil levels, as moisture decreased in upper layers.
CONCLUSIONS
This research work studied the ETa and WEP in a soybean crop grown in the productive area of Balcarce, Buenos Aires Province, Argentina, using the soil water balance equation. SWC decreased over crop growth stages until the start of grain filling (V3-R5), showing a clear correlation between the root WEP and the crop phenological stages. After a stress event in R4, SWC increased gradually again until the end of cycle of the crop, as a result of soil water recharge through precipitations and a reduced plant water uptake.
Furthermore, ETa values under no-water stress conditions were in average as much as 40% lower than the estimated value under standard conditions (ETc). These results indicate that crop growth and development conditions in a productive scenario can show evapotranspiration values different from those found in an experimental context, even if the crop has no water constraints. This could explain why in some cases crop yields in productive conditions are lower than in controlled conditions, shown in this study by a reduced production of above-ground biomass.
WEPs were similar to those found in field experiments under controlled conditions. The crop modifies the water extraction pattern based on the water availability in the different strata, with a preference for upper rather than deeper layers. When water availability in upper levels declines, plants increase extraction from deeper levels to supply their water needs.
1. Allen, R. G.; Pereira, L. S.; Raes, D.; Smith, M. 2006. Evapotranspiración del cultivo. Estudio FAO Riego y drenaje. Organ. las Nac. Unidas para la Agric. y la Aliment. 56: 300. [ Links ]
2. Allmaras, R. R.; Nelson, W. W.; Voorhees, W. B. 1973. Soybean and corn rooting in Southwestern Minnesota: II. Root distributions. Soil Sci. Soc. Am. J. 39: 771-777. https://doi. org/10.2136/sssaj1975.03615995003900040046x [ Links ]
3. Andrade, F. H.; Sadras, V. O. 2000. Bases para el manejo del maíz, el girasol y la soja. INTA-EEA Balcarce. Buenos Aires. Argentina. [ Links ]
4. Andriani, J. M.; Andrade, F. H.; Suero, E. E.; Dardanelli, J. L. 1991. Water deficits during reproductive growth of soybeans. I. Their effects on dry matter accumulation, seed yield and its components. Agronomie. 11: 737-746. https://doi.org/10.1051/agro:19910904 [ Links ]
5. Arya, L. M.; Blake, G. R.; Farrell, D. A. 1975. A Field study of soil water depletion patterns in presence of growing soybean roots: III. Rooting Characteristics and Root Extraction of Soil Water. Soil Sci. Soc. Am. J. 39: 437-444. [ Links ]
6. Batallanez, E. 1972. Capacidad de almacenaje de humedad para cuatro series de suelos del S. E. de la Provincia de Buenos Aires. Universidad Católica de Mar del Plata. [ Links ]
7. Brun, L. J.; Prunty, L.; Larsen, J. K.; Enz, J. W. 1985. Evapotranspiration and soil water relationships for spring wheat and soybean. Soil Sci. 139: 547-552. [ Links ]
8. Burch, G. J.; Smith, R. C.; G.; Mason, W. K. 1978. Agronomic and physiological respone of soybean and sorghum crops to water deficients II. Crop evaporation, soil water depletion and root distribution. Aust. J. Plant Physiol. 5: 169-177. [ Links ]
9. Corder, G. W.; Foreman, D. I. 2009. Nonparametric statistics for non‐statisticians: a step‐by‐step approach. Hoboken: John Wiley and Sons. [ Links ]
10. Costa da Silva, A., C.; Lima, L. A.; Fernandes de Almeida, W.; Silveira Thebaldi, M.; da Silva, A. C. 2017. Tifton 85 production under deficit irrigation. Revista de la Facultad de Ciencias Agrarias. Universidad Nacional de Cuyo. Mendoza. Argentina. 49(2): 117-126. [ Links ]
11. Cox, W. J.; Jolliff, G. D.; 1987. Crop-water relations of sunflower and soybean under irrigated and dryland conditions. Crop Sci. 27: 553-557. [ Links ]
12. Curto, L.; Covi, M.; Gassmann, M. I.; Cambareri, M.; Della Maggiora, A. 2016. Calibración de datos observados de contenido de agua en el suelo con sensores capacitivos. Meteorológica 2. [ Links ]
13. Dardanelli, J. L.; Suero, E. E.; Andrade, F. H.; Andriani, J. M. 1991. Water deficits during reproductive growth of soybeans. II. Water use and water deficiency indicators. Agronomie. 11: 747-756. https://doi.org/10.1051/agro:19910905 [ Links ]
14. Dardanelli, J. L.; Ritchie, J. T.; Calmon, M.; Andriani, J. M.; Collino, D. J. 2004. An empirical model for root water uptake. F. Crop. Res. 87: 59-71. https://doi.org/10.1016/j. fcr.2003.09.008 [ Links ]
15. Della Maggiora, A. I.; Echarte, L.; Suero, E. E.; Irigoyen, A. I.; Gardiol, J. M. 1998. Deficiencia de agua en los cultivos de maíz, girasol, soja y trigo en la localidad de Balcarce. Actas X Congr. Bras. Meteorol. y VIIl Congr. la Fed. Latinoam. e Ibérica Soc. Meteorol. [ Links ]
16. Della Maggiora, A. I.; Gardiol, J. M.; Irigoyen, A. 2000. Requerimientos hídricos. Capítulo 6. In: Andrade, F. H.; Sadras, V. O. (Eds.). Bases para el manejo del maíz, el girasol y la soja. Instituto Nacional de Tecnología Agropecuaria. p. 157-173. [ Links ]
17. Della Maggiora, A. I.; Gardiol, J. M.; Irigoyen, A. 2006. Coeficientes de cultivo de soja basados en la evapotranspiración de referencia Penman-Monteith. In: Actas XI Reunión Argentina de Agrometeorología. 5-8 de Septiembre de 2006. La Plata. Argentina. [ Links ]
18. Di Pietro, L.; Suero, E. 1983. Parámetros hidráulicos en un suelo Argiudol. Cienc. del suelo. 1: 1-7. [ Links ]
19. Eagleman, J. R.; Decker, W. L. 1965. The role of soil moisture in evapotranspiration. Agron. J. 57: 626-629. [ Links ]
20. Eung Ryoung, S. 1988. A simulation model for estimating evapotranspiration of soybean crop. Korean J. Crop Sci. 33: 254-261. [ Links ]
21. FAOSTAT. 2016. Food and Agriculture Organization of the United Nations. Statistics Division. Available in: http://www.fao.org/faostat/en/#home. Accessed on: August 13, 2019. [ Links ]
22. Fehr, W. R.; Caviness, C. E. 1977. Stages of soybean development. Iowa Agricultural Experiment Station Spec. [ Links ]
23. Ferreira, L.; Salgado, H.; Saulo, C.; Collini, E. 2011. Modeled and observed soil moisture variability over a region of Argentina. Atmos. Sci. Lett. 12: 334-339. https://doi. org/10.1002/asl.342 [ Links ]
24. Fischer, T.; Byerlee, D.; Edmeades, G.; Byerlee, D.; Edmeades, G. 2014. Crop yields and global food security. Aust. Cent. Int. Agric. Res. 1-660. [ Links ]
25. Gardiol, J. M.; Irigoyen, A. I.; Della Maggiora, A. I.; Silva, V. R. 1997. Patrón de extracción de agua de cultivos de maíz y soja en un Argiudol Típico de Balcarce. Rev. la Fac. Agron. 17: 137-142. [ Links ]
26. Hillel, D. 1998. Soil temperature and heat flow, environmental soil physics. Academic Press, San Diego, California. [ Links ]
27. Itier, B.; Flura, D.; Belabbes, K.; Kosuth, P.; Rana, G.; Figueiredo, L. 1992. Relations between relative evapotranspiration and predawn leaf water potential in soybean grown in several locations. Irrig. Sci. 13: 109-114. [ Links ]
28. Kirkham, M. B.; Grecu, S. J.; Kanemasu, E. T. 1998. Comparison of minirhizotrons and the soilwater- depletion method to determine maize and soybean root length and depth. Eur. J. Agron. 8: 117-125. https://doi.org/10.1016/S1161-0301(97)00019-1 [ Links ]
29. Kremer, K.; Reyes, L.; Fichet, T.; García de Cortázar, V.; Haberland, J. 2018. Physiological and production responses of olive (Olea europaea L.) cv. Frantoio under regulated deficit irrigation on a semiarid mediterranean weather condition (Cholqui, Maipo Valley, Chile). Revista de la Facultad de Ciencias Agrarias. Universidad Nacional de Cuyo. Mendoza. Argentina. 50(1): 73-83. [ Links ]
30. Liu, F.; Andersen, M. N.; Jacobsen, S. E.; Jensen, C. R. 2005. Stomatal control and water use efficiency of soybean during progressive soil drying. Environ. Exp. Bot. 54: 33-40. https://doi.org/10.1016/j.envexpbot.2004.05.002 [ Links ]
31. Mason, W. K.; Rowse, H. R.; Bennie, A. T. P.; Kaspar, T. C.; Taylor, H. M. 1982. Responses of soybeans to two row spacings and two soil-water levels. II. Water-use, root-growth and plant water status. F. Crop. Res. 5: 15-29. https://doi.org/10.1016/0378-4290(82)90003-x [ Links ]
32. McIntyre, B. D.; Riha, S. J.; Flower, D. J. 1995. Water uptake by pearl millet in a semiarid environment. F. Crop. Res. 43: 67-76. https://doi.org/10.1016/0378-4290(95)00035-O [ Links ]
33. Meyer, W. S.; Green, G. C. 1981. Plant indicators of wheat and soybean crop water stress. Irrig. Sci. 2: 167-176. [ Links ]
34. Ministerio de Agroindustria. 2016. Estudio del potencial de ampliación del riego en Argentina. PROSAP - FAO - ONU. Informe 123. [ Links ]
35. Montoya, F.; García, C.; Pintos, F.; Otero, A. 2017. Effects of irrigation regime on the growth and yield of irrigated soybean in temperate humid climatic conditions. Agric. Water Manag. 193: 30-45. https://doi.org/10.1016/j.agwat.2017.08.001 [ Links ]
36. Nagore, M. L.; Echarte, L.; Hector, F.; Della Maggiora, A. 2014. Crop evapotranspiration in Argentinean maize hybrids released in different decades. F. Crop. Res. 155: 23-29. https://doi.org/10.1016/j.fcr.2013.09.026 [ Links ]
37. Oke, T. R. 1987. Boundary layer climates. Earth-Science Reviews. https://doi.org/10.1016/0012- 8252(90)90005-G [ Links ]
38. Rasiah, V.; Kohl, R. A. 1989. Soybean root water uptake in two soils. Agric. Water Manag. 15: 387-393. https://doi.org/10.1016/0378-3774(89)90054-1 [ Links ]
39. Reicosky, D. C.; Millington, R. J.; Klute, A.; Peters, D. B. 1972. Patterns of water uptake and root distribution of soybeans (Glycine max.) in the presence of a water table. Agron. J. 64: 292-297. [ Links ]
40. Ritchie, S.; Hanway, J.; Thompson, H. 1985. How a soybean plant develops. Iowa State Univ. Sci. Technol. Coop. Ext. Serv. 20. [ Links ]
41. Salazar Lea Plaza, J. C.; Moscatelli, G. 1989. Mapa de suelos de la Provincia de Buenos Aires. Edipubli S.A., Buenos Aires, Argentina. [ Links ]
42. Sinclair, T. R.; Hammond, L. C.; Harrison, J. 1998. Extractable soil water and transpiration rate of soybean on sandy soils. Agron. J. 90: 363-368. [ Links ]
43. Stone, L. R.; Teare, I. D.; Nickell, C. D.; Mayaki, W. C. 1976. Soybean root development and soil water depletion. Agron. J. 68: 677-680. [ Links ]
44. Taylor, H. M.; Willatt, S. T. 1983. Shrinkage of soybean roots. Agron. J. 75: 818-820. [ Links ]
45. Turner, N. C.; Begg, J. E.; Raeson, H. M.; English, S. D.; Hearn, A. B. 1978. Agronomic and physiological responses of soybean and sorghum crops to water deficients III. Components of leaf water potential, leaf conductance, CO2 photosynthesis, and adaptation to water deficients. Aust. J. Plant Physiol. 5: 179-194. [ Links ]
46. Wei, Z.; Paredes, P.; Liu, Y.; Chi, W. W.; Pereira, L. S. 2015. Modelling transpiration, soil evaporation and yield prediction of soybean in North China Plain. Agric. Water Manag. 147: 43-53. https://doi.org/10.1016/j.agwat.2014.05.004 [ Links ]
ACKNOWLEDGEMENTS
We specially wish to thank researchers and workers of Unidad Integrada INTA-UNMdP Balcarce, Argentina for their assistance during the experiment.
This study was supported by Consejo Nacional de Investigaciones Científicas y Técnicas, Argentina (CONICET, grant PIP N° 11220130100347CO) and by Universidad de Buenos Aires, Argentina (grant UBACyT 2012–2014 N° 20020110200045). Curto L. holds a fellowship from CONICET.

