


 English (pdf)
 Article in xml format
 Article references
 Send this article by e-mail
 Cited by SciELO
  Similars in
SciELO
Similars in
SciELO 
 Permalink
Introduction
Common bean (Phaseolus vulgaris L.) is widely grown in both small and large areas in Brazil, where it plays an important role socially, culturally and economically 22. Although initially recognized as a subsistence crop, common bean production has been growing; therefore, several techniques have been adopted in its cultivation, including irrigation 17, biostimulant 1, soil cover, genetic parameters 23 and improved crop practices 15.
Brazil, the third world’s largest producer of common beans, produced 3.3 million tons from 3.1 million hectares in 2017/2018, with an average yield of 1,043 kg ha-1 (9. As the crop is an important source of dietary protein, it plays a key role in food security. Accord ingly, field experiments have been carried out across the country to test different cropping systems. Due to uneven soil and climate conditions, large experimental error is produced in field experiments, thereby decreasing the statistical power in verifying minimal significant differences between treatments.
The size of experimental plots may vary depending on the soil heterogeneity throughout the experimental area and intrinsic characteristics of each crop 12. Several aspects should be taken into account when determining the optimal plot size, such as crop type, number of treatments, technology, available land, and financial resources 30. Experimenters usually define the plot size based on site-specific conditions, available area or their personal research experience.
The plot size directly influences the experimental precision. Currently, plot sizes having four to six plant per row and measuring four to five meters long are used in most field studies with common beans. However, depending on the nature of the study, the number of experimental plots may be too large, so that field experimentation becomes virtually unfeasible. Smaller plot sizes may come as a solution but to the detriment of experimental precision.
Therefore, plot size and number of replicates should be optimally determined to obtain greater experimental precision 31. To do so, several methods have been used to determine the size and shape of the experimental plots. Among them, the Modified Maximum Curvature Method (MMCM) 20 stands out. This method algebraically determines through a regression equation the optimal relationship between plot sizes and their respective coef ficients of variation 27. With this model, one can minimize experimental error, optimize resources, and ensure maximum precision 8.
The objective of this work was to estimate, using the Modified Maximum Curvature Method, the optimal plot size for determining yield components and the final plant stand of the common bean, with the aim of optimizing the use of resources without compromising the reliability of data obtained from experiments with this legume in the northern region of Minas Gerais, Brazil.
Material and methods
The study was conducted at the Experimental Farm of the Universidade Estadual de Montes Claros (UNIMONTES), located in the municipality of Janaúba, northern Minas Gerais state, Brazil (15° 48’ 32”S, 43° 19’ 3”W, and altitude of 533 m). The region’s climate is Aw type, which corresponds to rainy summers and dry winters, according to the Köppen’s clas sification. In the experimental area, the soil was classified as yellow-red Latosol (Ferralsols, WRB / FAO; Oxisols, Soil Taxonomy). The rainy season is normally marked by long dry spells in the middle of the season, followed by intense heat (25-35°C), strong sunlight and low relative humidity.
The experiment consisted of a uniformity trial with the cultivar BRSFC-402 sown at a spacing of 0.5 m between plant rows and 10 plants per meter within the row. Twenty 20-m-long central rows were considered for measurements, totaling 4,000 plants on an area of 200 m2.
We evaluated grain yield (kg ha-1), measured with a field scale and corresponding to the total mass of grains per basic unit (BU); final plant stand (FS), given by different BU combi nations; mean number of pods per plant (NPP), obtained by direct counting; mean number of grains per pod (NGP), and mean 100-grain weight (M100). Number of grains per pod and M100 were estimated using a sample of five plants within each BU.
At harvest, the number of beans (grains) per plant in each BU was counted to allow the esti mation of the final stand (FS). Then, results were converted to number of grains per hectare. The plants harvested in each BU were identified and taken to the laboratory, where the total number of pods of these plants was counted to estimate the average number of pods per plant (NVP).
The pods were threshed and the beans were counted to estimate the average number of grains per pod (NGP) by dividing the total number of grains by the total number of pods of each BU. The 100-grain weight (M100) was estimated by weighing three samples containing 100 beans collected from each BU, which were corrected to 13% humidity. Grain yield was estimated by weighing all the beans produced in each BU, and results were expressed as kg ha-1 and corrected to 13% humidity.
For each evaluated characteristic, we considered only BU arrangements that allowed plants to cover the entire experimental area. Thus, the basic units were combined in 36 plot sizes and 14 plot shapes with the largest relative information (RI) for the same BU size. The RI model considers the effect of the plot shape - width and length - on experimental precision. Thus, 14 plot sizes were obtained by combining BUs to form rectangular plots along the crop rows (Table 1, page 58).
Table 1: Tabla 1: Number of plots (NP), plot shape, number of rows (NR), number of basic units per row (BUR), number of basic units (NBU) and total plot area (TPA). Número de parcelas (NP), formato, número de filas (NR) y de unidades básicas por fila (BUR), número de unidades básicas (NBU) y área de parcela total (TPA).

Using the Modified Maximum Curvature Method (MMCM), adapted by Meier & Lessman (1971), the point of maximum curvature or optimal plot size was determined by a potential regression equation.
 (1)
(1)
where:
y = coefficient of variation,
x = plot size in basic units and a and b are constants of the model.
The point of maximum curvature was estimated by the following equation:
 (2)
(2)
where:
X0 = value of the abscissa corresponding to the point of maximum curvature, i.e. = the estimator of the optimal plot size
 and B̂ = the respective estimates of A and В, which are constants of the equation.
Relative information is determined in percentage by the ratio of variances: the variance of the plot composed of one BU (V1) and the comparable variance (Vc) obtained by dividing the variance by its corresponding plot size in BU 19.
 (3)
(3)
Using the RI method, we initially considered the variance of grain yield, FS, NPP, NGP and M100, between the X BU areas of each plot shape defined on the experimental field:
 (4)
(4)
 (5)
(5)
where:
Xi = the studied variable of the i-eth plot,
M = the mean of the variable measured in the plots with a size of X BUs; and NP is the number of plots with a size of X BUs.
Statistical analyzes to determine plot sizes by MMCM were built using Excel® based on a routine proposed by Donato et al. (2008, 2018). The models were selected according to the significance of the coefficients and the highest coefficients of variation and adjusted coeffi cients of variation, obtained through the analysis of variance and the t test in the R software 10. To determine plot shapes by the relative information method, simulation routines were built and run on Excel®.
Results and discussion
Of 36 tested plot shapes, 14 having greater relative information (RI) were selected. Therefore, the shapes and their respective RIs were determined for final plant stand, grains per pod, 100-grain weight, number of pods per plant, and yield.
Changes in relative information are not directly related to plot size in basic units, but rather to the shape of the plot 31. Due to the way the method works, the plot shaped as 1 R x 1 BU/R has the largest relative information for all analyzed variables and is used as reference (Table 2).
Table 2: Tabla 2: Variables anallyzed for the shape of the plot for experimental evaluations with common bean. Variables analizadas para la forma de la parcela para evaluaciones experimentales con frijol común.
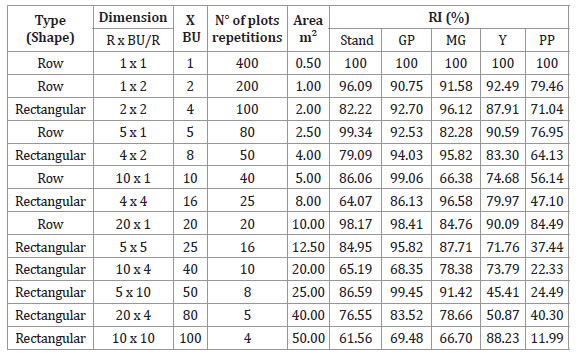
Plot shape (row or rectangular), dimensions (row and basic unit per row), number of basic units (BUs), number of plots (NP), plot area and relative information (%) with various shapes for stand, grains per pod (GP), 100-grain weight (MG), yield (Y) and pods per plant (PP).
Formato de trazado (fila o rectangular), dimensiones (fila y unidad básica por fila), número de unidades básicas (BU), número de trazado (NP), área de trazado e información relativa (%) con varios formatos para soporte, granos por vaina (GP), masa de 100 granos (MG), rendimiento (Y) y vainas por planta (PP).
Therefore, based on results presented in Table 2, the 5 R x 1 BU/R plot shape, with five BUs, ensures RI values closer to 100% for all studied variables, so this plot shape is the most suitable for field experiments with the common bean.
By grouping the 14 plot sizes, the lowest and highest coefficients of variation (CV) were associated with the combinations with the largest and lowest number of BUs, respectively (Table 3, page 60).
Table 3: Tabla 3: Common bean yield evaluation in a 400 BU uniformity test (1 BU = 0,5 m²). Evaluación del rendimiento del frijol común en una prueba de uniformidad de 400 BU (1 BU = 0,5 m²).

Number of plots (NP), with sizes (rows (Xr) × basic units per rows (Xpr-1), basic units (BU), area (m²) and respective estimates of means (m), variance (s²), standard deviation (SD) and coefficient of variation (CV).
Número de parcelas (NP), con tamaños (filas (Xr) × unidades básicas por filas (Xpr-1), unidades básicas (BU), área (m²) y estimaciones respectivas de medias (m), varianza (s²), desviación estándar (DE) y coeficiente de variación (CV).
The relationship between these quantities tends to be inversely propor tional because larger plots usually correlate negatively with lower coefficients of variation. An inverse relationship may occur on highly heterogeneous soils or with the use of unstable plant material; in both cases, large plots may produce high coefficients of variation 12.
In field trials, CV indicates experimental precision. Plot sizes with lower CVs are recom mended for experimental purposes 8. The inverse behavior between plot size (BU) and coef ficient of variation (Table 3, page 60) has also been found in several similar studies 4,8,27,30.
Figure 1 (page 61) depicts the relationship between the coefficient of variation and plot size in BU.

*** Significant at a 0% level of significance (p < 0.001).
*** Significativo a un nivel de significancia de 0% (p <0,001).
Figure 1: Figura 1: Graphical representation between coefficient of variation (CV) and plot size in basic unit (BU) to estimate optimal plot size (XMC) of yield (A), final plant stand (B), pods per plant (C), grains per pod (D) and 100-grain weight (E) for the common bean. Representación gráfica entre el coeficiente de variación (CV) y el tamaño de la parcela en la unidad básica (BU) para estimar el tamaño óptimo de la parcela (XMC) de productividad (A), soporte (B), vainas por planta (C), granos por vaina (D) y masa de 100 granos (E) para frijol común.
The highest estimates of the optimal plot sizes or maximum curvature point (XMC) were associated with yield (Figure 1A, page 61) and final plant stand (Figure 1B, page 61), both having five BUs, followed by the number of pods per plant (Figure 1C, page 61), number of grains per pod (Figure 1D, page 61) and 100-grain weight (Figure 1E, page 61), with approximate plot sizes of four, four and two BUs, respectively.
The coefficient of determination of optimal plot sizes ranged from 0.7366 to 0.9621 for the common bean’s evaluated phenotypic descriptors (Figure 1, page 61), with the best fit associated with yield (Figure 1A, page 61), followed by final stand (Figure 1B, page 61), 100-grain weight (Figure 1E, page 61), beans per pod (Figure 1D, page 61) and pods per plant (Figure 1C, page 61). The coefficients of determination were high enough to ensure adequate precision in defining the plot size.
Using the MMCM, Santos et al. (2015) determined different plot sizes for sunflower and reported R2 values ranging from 0.8806 to 0.9648 for optimal plot sizes. With this same estimator, R2, Cargnelutti Filho et al. (2018) identified the optimal plot size (Xo, in m²) with a coefficient of 0.9989 to assess fresh mass of turnips. For experimental evaluation of cactus pear, cv. Gigante, Guimarães et al. (2019) determined different plot sizes with R² between 0.8082 and 0.9352. These results reaffirm the high adjustment quality of MMCM.
Appropriate plot sizes varied with respect to the evaluated characteristics, with esti mates of Xo and X falling between 1.64 and 5.00 and two and five BUs, respectively (Figure 1, page 61). The smallest estimated plot size was associated with the 100-grain weight (2 BUs), followed by pods per plant and grains per pods (4 BUs), and by yield and final plant stand (5 BUs) (Figure 1, page 61). The MMCM, besides estimating the optimal plot size determined by the critical level, also presents intermediate sizes, as found in several studies 6,16,18,28.
Nevertheless, keeping reducing the coefficient of variation beyond the critical point is not beneficial to experimental precision, because, from the point of maximum curvature on, the coefficient of variation assumes a linear behavior 28.
The use of suboptimal or divergent plots may result in low experimental precision, higher experimental errors and high operational cost 3,5,8 13,14,25. In this study, depending on the investigated agronomic trait, plot size ranged from two to five BUs for field trials with the common bean. Similar results for the same crop was reported in the state of Mato Grosso, Brazil, with 3 m² or 60 plants 29.
Studies with common bean have been developed with plots of various sizes, with areas of 24 m² 4, 100 m² 21, 72 m² 26 and 24 m² 2. These plot sizes are defined based on factors including available resources, the researcher’s experience, and limitations on the experimental area. However, 5 m² plots ensure significant precision for experimental evaluation, thereby optimizing agricultural inputs and human resources. Thus, in line with the results obtained in this work, the experimental area can be optimized with significant reduction in plot size.
Field experiments with the common bean should be designed with five BUs, because all traits evaluated in this work are measured together. Moreover, the modified maximum curvature method, despite being a procedure with algebraic determination 7, tends to estimate smaller plots when compared to other methods 12,32. By following this statis tical recommendation, the experimenter will gain efficiency in the use of resources without compromising the reliability of collected data.
Conclusions
Yield and final plant stand require larger plot sizes to be evaluated with higher experi mental precision. For experimental evaluation of common beans involving grain yield and its primary components (final stand, number of pods per plant, number of grains per pod and 100- grain weight), the plot size should be composed of five basic units in the northern region of Minas Gerais, Brazil.
The plot shape of five-rows x one BU/row, with five BU, ensures relative information values closer to 100% for all evaluated variables. This shape is suitable for experimental purposes with the common bean in the northern region of Minas Gerais, Brazil.

