


 English (pdf)
 Article in xml format
 Article references
 Send this article by e-mail
 Cited by SciELO
  Similars in
SciELO
Similars in
SciELO 
 Permalink
Introduction
Soybean (Glycine max L. Merrill) is a legume of great importance in the world economy because of its extensive cultivation and world trade. It is widely used as a raw material in animal feed, food, vegetable oils, biofuel, and the chemical industry. Brazil is the largest exporter and the second-largest producer of oilseeds. In the 2019/2020 harvest, the country had an average productivity of 3.321 kg ha-1, resulting from a production of 118.8 million tons of grain in 35,760.4 thousand hectares of land. During this harvest, the culti vated area increased by 1.7% relative to the past harvest 2,10, due to the expansion of the agricultural frontier with the exploration of the Brazilian semiarid region. Consid ering the need for irrigation, as well as the high temperatures that prevail in the semi-arid region, this expansion may constitute an opportunity for the diversification of crops in the region, particularly for seed production since irrigated crops require greater investment. Therefore, it is necessary to work with cultivars adapted to the new growing conditions, which requires the evaluation of the behavior of soybean genotypes under the non-edaphoclimatic and specific desired agricultural conditions. It is crucial to consider the possibility of not finding an adapted genotype with the desired characteristics among those available. In this case, it is necessary to work with breeders to develop adapted cultivars with charac teristics suitable for the market.
The cultivar experiments, sometimes called value of cultivation and use (VCU) tests, are generally carried out in different environments, either local or through years of cultivation, characteristic of the region of interest. When several genotypes are evaluated in more than one environment, the presence of a genotype-environment interaction is common (G × E). This phenomenon is defined as the differential behavior of genotypes across environments and assumes an important role in phenotypic manifestation. The G × E interaction, when predominantly qualitative or crossed, hinders the selection process or recommendation of cultivars, since the order of genotypes is altered in the assessment environments.
Information on genotypic performance may also be relevant when choosing the parent strains for breeding programs. In this context, although productivity is the character istic of greatest interest, other characteristics are relevant for soybeans and are therefore considered in the genotypic evaluation. When information on various traits-whether morphological, agronomic, biochemical, or molecular-is available, it becomes possible to carry out genetic divergence studies. However, even though the presence of genotype-en vironment interaction in soybeans and other crops is notorious, there is little information about its influence on divergence studies since genetic divergence studies are generally performed in only one evaluation environment.
Filling this knowledge gap requires intensive efforts of researchers, more specifically the curators of germplasm banks and breeders since divergence studies are important with respect to two main aspects. The first aspect is related to the intrinsic activities carried out in germplasm banks to evaluate the entire variation structure to preserve it and optimize its maintenance in nuclear collections. A second aspect, no less important in relation to the first, is that studies of genetic divergence are used to define groups with the intention of directing crossings that could potentially generate segregated populations with greater genetic variability 25,34. Indeed, considering that the interaction between genotypes and environments can alter the characterization of genotypes in groups according to environ mental conditions, it may be challenging to define the crossings.
The aforementioned considerations and the lack of studies of this nature motivated the realization of the present work, which proposes to study the effect of the genotype- environment interaction on the genetic divergence of soybean genotypes evaluated under semiarid conditions.
Material and methods
Environmental characterization
This study was carried out during the dry seasons of 2016-2017, and rainy seasons of 2017-2018 in the municipality of Mossoró, Rio Grande do Norte, Brazil (5° 03' 37″ " S, 37° 23' 50"″ W, 72 m altitude). According to the Koppen climate classification 1, the climate of the site is DdAa, semi-arid, and megathermal, with little or no excess precipitation during the year; in addition, it is BShw - dry and very hot.
The average meteorological data for the experimental period are shown in Figure 1 (page 4).

Figura 1: Valores promedio de temperatura máxima, media y mínima del aire (°C), hume dad relativa (%), radiación solar (MJ m-2 día-1) y precipitación (mm) para cuatro cultivos de soja en las campañas 2016/2017, 2017.1, 2017.2 y 2018.1.
The experiments were started on the following planting dates: September 25, 2016, March 29, 2017, September 30, 2017, and March 16, 2018.
The soil of the experimental field was classified as typical red dystrophic argisol 14, whose chemical analysis results, at a depth of 0.20 m, before starting each experiment are shown in Table 1.

Germplasm
The identification and characteristics of the soybean genotypes evaluated and belonging to Embrapa Meio-Norte are shown in Table 2 (page 5).
Table 2: Category, identification, name, maturation group and cycle of 21 soybean geno types evaluated in four harvests under semiarid conditions.
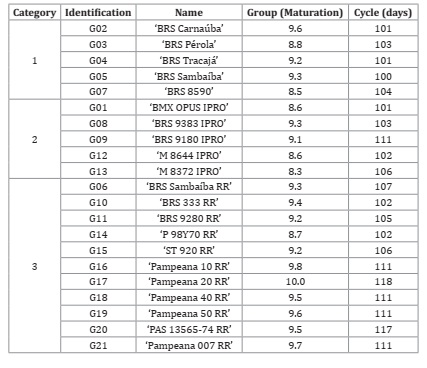
Category 1: conventional soybean genotypes. Category 2: high-yield soybean genotypes, re sistant to glyphosate and which have protection and suppression against some soy pests. Category 3: glyphosate resistant soybean genotypes.
Categoría 1: genotipos convencionales de soja. Categoría 2: genotipos de soja de alto rendi miento, resistentes al glifosato y que tienen protección y supresión contra algunas plagas de la soja. Categoría 3: genotipos de soja resis tentes al glifosato.
Experimental details
The seeds were inoculated before sowing with 4 g of peat inoculant per kg of seeds (Total Nitro Ultra) and 500 ml ha-1 of liquid (TotalNitro Full) was applied to the seeds in the planting furrow, ensuring that the seeds were completely covered by the inoculant. The inoculants were obtained from Total Biotecnologia, Curitiba, Paraná, Brazil. According to the desired spacing, sowing was performed manually with the help of previously drilled wooden rulers.
Weed control was performed manually with hoes after sowing, as recommended (Dugje et al. 2009). Due to the unstable precipitation during the experimental period, water comple mentation was carried out when necessary. Irrigation was carried out by spraying, with a daily watering shift divided into two applications (morning and afternoon), according to the water requirement of the culture and based on the reference evapotranspiration (ETo) rate. During the rainy season, irrigation was performed only when necessary.
Fertilization was carried out as recommended for the crop and based on the results of the soil analysis, with 60 kg ha-1 of P2O5 being applied during planting and 60 kg ha-1 of K2O in coverage 16. The sources of Phosphorus and Potassium were simple superphosphate and potassium chloride, respectively.
Evaluated keywords
The evaluated characteristics were: a) plant height: measured using a ruler, across ten random plants in the plot in phase R5.3, according to the methods described in the study of 9,35; b) dry matter: evaluated using samples from ten plants per plot; the samples were placed in an oven with forced air circulation at 65 °C, until they reached a constant weight, according to the method of Brandt et al. (2006); c) oil content: determined with 30 g (ground) of seeds from each plot using the Near Infrared Reflection (NIR) technique and expressed as a percentage (%), according to the method of Heil (2010); d) number of pods per plant: obtained by counting the number of pods per plant; e) number of grains per pod: obtained by counting the number of grains in the pods divided by the total number of pods; f) weight of one hundred seeds: determined according to the mass and total number of seeds per experimental unit; g) productivity: upon reaching physiological maturity (95% of the mature pods), the soybean plants were harvested from the two central rows of each plot, 4 m2, with a 0.5 m edge left unharvested. After harvesting, the plants were trailed, and the seeds were then weighed, after drying (12% humidity) and cleaning, to determine the grain yield of kg ha-1; (h) days for flowering: the days from emergence necessary to have an open flower in 50% of the plants of the plot; this characteristic was evaluated using ten plants chosen at random, according to the method employed by Carvalho (2014); and i) days for maturation: determined from the number of days from emergence necessary to have 95% of mature pods; this characteristic was evaluated using ten random plants in the plot, according to that method.
Statistical analysis
The REML/BLUP analysis was performed using Model 54 of the SELEGEN software 30. Through this model, the empirical BLUP predictors of genotypic values free from interaction were obtained, and were given by / , where / is the average of all environments, and /is the free genotype effect of the genotype × environment interaction. For each environment “j,” genotype values are predicted by /, where /is the environment average “j,” / is the genotypic effect, and / is the effect of the genotype × environment interaction concerning the genotype “i”. The generalized Mahalanobis distances were calculated from the matrix of the genotypic averages of each characteristic for each genotype and from the residual variance-covariance matrix 20. Cluster analysis was performed with the Mahala nobis distance matrix between genotypes, using the unweighted pair group method with arithmetic mean (UPGMA). The quality of the adjustment was quantified using the cophe netic correlation coefficient 32. The analyses were processed using the Genes program (2016), and the Pheatmap 18 and Biotools31 packages of Project R 27.
Results and discussion
The results of our experiments showed that the data obtained for the various character istics were within the range observed for soybeans, with the lowest value observed for oil content (4.28%), and the highest for dry matter (51.18%). With the exception of dry matter, the estimated values of the evaluated characteristics were within the CV range observed for soybean 7,11,19,21,26. The highest selective accuracy was verified for flowering and maturation and the lowest for dry matter, conforming to the lowest precision observed for the latter characteristic. The accuracy of the results of the present study is considered low for dry matter (<0.30), moderate for the number of pods per plant (0.50 to 0.69), very high for flowering and maturation (>90), and high for the other characteristics (0.70 to 0.89), according to Resende and Duarte, 2007 (Table 3).
Table 3: Deviance analysis, estimates of variance components and genetic and phenotypic parameters for nine characters measured in soybean genotypes evaluated in four trials conducted under semiarid conditions.
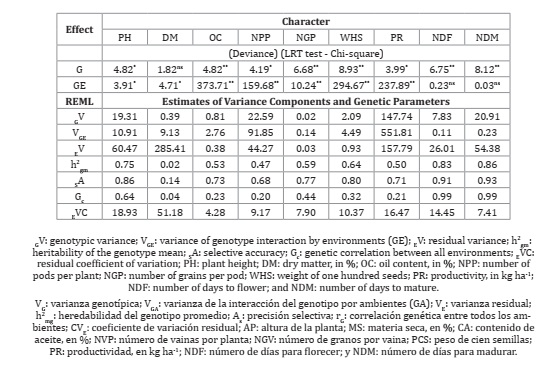
A significant effect of genotypes was observed for all characteristics evaluated, except for dry matter, indicating genetic heterogeneity between the genotypes, a fact that corroborates the estimates of average heritability. Although not very high, this variability can be corrobo rated by heritability estimates, except dry matter. Heritability in the broad sense quantifies the fraction of phenotypic variance resulting from genotypic causes. Heritability ranges from 0 to 1.0, with estimates close to the unit indicating lesser environmental effect on the char acteristic. Quantitative characteristics have a greater environmental effect and tend to have lower heritability values 4. This occurred with dry matter, but for most of the other charac teristics, heritability can be considered intermediate. For plant height, flowering, and matu ration, heritability was high, indicating less environmental effects on these characteristics.
The genotype-environment (G × E) interaction was significant for all characteristics, with the exception of the number of days for flowering and maturation (Table 3, page 6). The presence of the G × E interaction is a common phenomenon in the evaluation tests of soybean cultivars and reflects the differential behavior of the genotypes in different environments 28. The variance component of the G × E interaction was superior to that of the genotypic variance for the characteristics of dry matter, oil content, number of pods per plant, number of grains per pod, weight of 100 seeds, and productivity (Table 3, page 6), indicating a greater influence of the interaction on phenotypic variation. This is not commonly observed duirng the evaluation of soybean genotypes in various environments. Generally, for soybeans, the effect of genotypes has a greater effect on the phenotype 3,5,22,26,33.
The interaction can be quantitative because of the magnitude of the differences between the genotypes in the environments or qualitative due to the lack of genotypic correlation in the environment 15,24. In this work, considering the values of genotypic correlation in all envi ronments, ranged from 0.02 (dry matter) to 0.64 (plant height), the interaction was predomi nantly qualitative for all characteristics for which the G x E interaction existed (Table 3, page 6). The predominance of cross-interaction hinders the work of breeders because the character istics of the genotypes are significantly altered in different environments. In this situation, it is difficult to recommend a genotype suitable for all environments, and specific recommenda tions are necessary. On the other hand, it is important to emphasize that the northeast region of Brazil has proven to be highly suitable for irrigated cultivation, including that of fruits, vege tables, and grains. On the other hand, because it does not have well-defined climatic seasons, being most often defined only in terms of the rainy season and the dry season, it can lead researchers and producers to make errors when recommending genotypes for cultivation in semi-arid conditions. Thus, studies such as the one presented in this work become quite relevant since the agricultural frontier for soybean cultivation has increased in the northeast region of Brazil, as has the demand for adapted cultivars. The presence of cross-interaction has also been mentioned by several authors when evaluating soybean cultivars under different edaphoclimatic conditions 8,11,23,26,33.
The hierarchical clustering analysis (UPGMA) showed different results throughout the evaluations, although there was little discrimination between the genotypes (Figure 2, page 8).

Figura 2: Dendrogramas de UPGMA obtenidos de la matriz de distancias de Mahalanobis entre genotipos de soja evaluados en cuatro pruebas realizadas en condiciones semiáridas.
It is noteworthy that the estimates of cophenetic correlation were higher than 0.85 in all evaluations, indicating a high quality of grouping; that is, there is a lot of similarity between the original and final dissimilarity matrices (28, dutra).
In 2016, three groups of genotypes were determined. The first consisted of G-21, G-08, G-18, G-17, G-19, and G-07. The second group was formed only by genotypes G-15, G-11, and G-03. The third group consisted of all other genotypes. In the 2017 A evaluation, all genotypes were classified in practically the same group, with the G-12 genotype not being grouped (Figure 2, page 8). In the evaluation of 2018, the genotype not grouped with the other genotypes was G-14. In the 2017 B evaluation, genotypes G-07, G-01, and G-04 were classified together in a group, while the other genotypes formed the second group. The joint analysis subdivided the genotypes into a smaller group composed of G-04, G-03, G-02, G-12, G-07 and G-01. The second group included all other genotypes.
To evaluate the contribution of the characteristics to diversity, the technique of main compo nents was used. In all evaluations, the first four main components explained more than 70% of the total variation observed, revealing a reduction in the multidimensional space from nova to just four main orthogonal components (Table 4, page 8).
Table 4: Character contribution to the eigenvalue λi in the analysis of major components involving soybean genotypes evaluated in four tests conducted under semiarid conditions.

Using the weights in the first four components, the characteristics with the greatest participation in the divergence considering all four evalua tions were productivity, number of pods per plant, and the number of days for maturation. In the joint analysis, the most prominent characteristics were plant height and productivity. Also worth mentioning is the characteristic of the number of grains per pod in the two evaluations and in the joint analysis. Considering that for the aforementioned characteristics, there was a predominance of cross-interaction (Table 3, page 6), it appears that the G × E interaction has a relevant weight in the ordering of distances and, consequently, changes in the groups formed.
Another result that reinforces the fact that the order of the distances was altered in the different evaluations is that of the estimates of the correlations between the dissimi larity matrices. The correlations were practically non-significant, except for the correlation between the joint analysis and the 2017 B assessment (Figure 3).

Figura 3: Correlaciones entre matrices de distancia de Mahalanobis de genotipos de soja evaluadas en cuatro ensayos realizados en condiciones semiáridas.
Although there is vast literature that addresses the effects of the G × E interaction on the selection and identification of cultivars, resulting from the differential behavior of geno types in the environment, little attention has been paid to the effect of the interaction in diversity studies. Considering that divergence studies are used for determining the initial direction of crossings in order to obtain populations with great variability and a high mean for the characteristics of interest, it is relevant to investigate the effect of the interaction in the formation of heterotic groups, as in the nuclear collections. In the present study, there were differences in the grouping during the four evaluations.
The presence of the genotype-environment interaction effect confused with the geno typic effect in each of the four evaluations, not only resulted in differences in the groups, but also made it difficult to differentiate the evaluated genotypes. The use of the estimates of the free genotypic means of the interaction obtained in the joint analysis may be a more adequate alternative to define the heterotic groups and, consequently, the crossings to be performed. In the present study, crosses were made between the genotypes of the group consisting of G-04, G-03, G-02, G-12, G-07, and G-01 and the genotypes of the second group, in particular, the G-05 genotype. The greatest dissimilarity was found between genotypes G-01 and G-05, shown in red on the heat map (Figure 4, page 10).
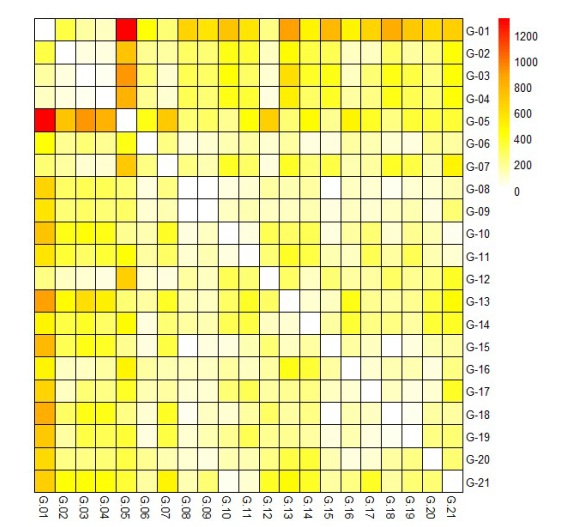
Figura 4: Distancias de Mahalanobis de genotipos de soja evaluados obtenidos en el análi sis conjunto de cuatro pruebas realizadas en condiciones semiáridas.
Crosses can be made between the G-01 genotype and the G-13, G-15, and G-18 genotypes.
Conclusions
The grouping of soybean accessions is dependent on the evaluation conditions, mainly because of the effects of the genotype por environment interaction. Without the effect of the interaction, the joint analysis allowed us to obtain two groups of genotypes. The most suitable crosses were those carried out between the genotypes BRS Tracajá, BRS Pérola, BRS Carnaúba, M 8644 IPRO, BRS 8590, and BMX OPUS IPRO, and the BRS Sambaíba genotype, especially the one between BMX OPUS IPRO and BRS Sambaíba genotype, which is the most dissimilar.

