


 Inglés (pdf)
 Articulo en XML
 Referencias del artículo
 Enviar articulo por email
 Citado por SciELO
  Similares en
SciELO
Similares en
SciELO 
 Permalink
Introduction
Given that flowers are perishable and temperature-sensitive products, using a cold supply chain (SC) is imperative for avoiding financial losses 7,19. In cut flower production, supply chain management is key for business design 19,30. In this sense, optimization levels and SC best practices in the flower industry need to improve production efficiency and distribution.
The supply chain management (SCM) concept coordinates the different corporate partners, internal departments, processes, and customers along a supply chain 6,31. Supply chain integration allows gaining competitive advantages through SCM, involving internal integration through effectively exchanging information with customers and suppliers. By achieving integration, the SC functions as one single unit directly driven by customer demand 12,18,26. In this sense, several models have been developed to measure SC performance, and the SCOR model stands as a powerful tool to evaluate SC’s activities and performance, optimizing production, distribution, and sales processes 1,17.
The SCOR model was developed by the Supply Chain Council (SCC) in 1996 with the intention of understanding, describing, and assessing supply chains. This model provided a general framework, as well as standard terminology, common metrics, and best practices (22,34. The SCOR model follows a hierarchical structure with different levels in the supply chain and a basic structure comprising three levels. This model may help understand a particular supply chain by mapping it in terms of the business processes 22,29,34. After selecting the appropriate process type, the configuration that best fits the supply chain is finally chosen. Application complexity depends on the type of product, demand, data reliability, and geographical distribution of both customers and suppliers 9,39.
The multicriteria methodology Analytic Hierarchy Process (AHP) structures complex decisions into hierarchies, translating goals into measurable criteria and sub-criteria, which, in turn, can lead to alternative decisions. It assigns priority to each hierarchy level. Alternative priorities are then compared with those of the criteria determining alternative final importance 4,5,33. Saaty and Vargas (2012) suggested that each group member makes individual pairwise comparisons and preference judgments about the alternatives, establishing group priorities. Thus, the individual preference geometric means allow calculating a preference matrix establishing group priorities 27. The combination of AHP 33 and the SCOR model, together with experts in the field, could accurately determine the most important processes of the SC given the specific product and company, establishing process efficiency.
Our study tests both SCOR and AHP models to analyze the SC of the flower industry, identifying those processes to be redesigned, achieving higher levels of competitiveness. Regarding the Ecuadorian flower industry and given the shortcomings in competitiveness and logistics performance, we decided to apply the study to the Ecuadorian flower sector, as a case study.
With an encompassing purpose of research at sector level, Ecuadorian companies and organizations related to flower production and market were considered. In this regard, various authors have already studied the floriculture sector SC. Villagrán et al. (2021) designed the structure of the supply chain management for the Colombian flower sector. Verdouw et al. (2013) explored the virtualization of the floriculture supply chain in the Netherlands and Janssen et al. (2016) focused on collaboration in the Dutch flower sector supply chain. Meanwhile, the African floriculture supply chain was examined by Button (2020), and recently, Karpun et al. (2020) developed a conceptual model for flower supply chain management.
Flowers are the fourth export product in Ecuador, after oil, bananas, and shrimp. From 2014 to 2018, exports of cut flowers to different destinations reached an average value of about USD 800 million. However, few studies approach supply chain analysis (Mendonza Lima et al., 2021 and Tagarakis et al., 2021). These authors suggested introducing a traceability system optimizing time, money, personnel, internal communication and, of course, guaranteeing flower quality. According to Herrera-Granda et al. (2020), implementing the SCOR model in the production process of flower companies would improve end-costumer services.
Our research intends to benefit different areas: Economically, this study will enable the human, material, and technological resources to be optimized and controlled. Concerning supply technology, our study may assist in the creation of a process/ performance monitoring application. Consequently, this knowledge will allow for a more efficient activity, leading to a more significant market share in the European Union, which is currently at 4%. In the case of Ecuador, the methodology proposed could also be applied to other major sectors of the Ecuadorian economy, such as the shrimp and banana sectors.
Materials and methods
Supply Chain Operations Reference (SCOR)
The SCOR model structure and the interrelationship among processes were confirmed by Zhou et al. (2011). The performance attributes serve to define generic supply chain characteristics and to describe the supply chain strategy. The SCOR model metrics are organized around the performance attributes and have different hierarchical levels, in the same way as SCOR processes 22,34,41.
Given that when establishing the relevant processes, only those belonging to levels 1 and 2 of the SCOR model are used, our analysis uses only level 1 performance attributes and metrics for selecting the target process 22,34.
Analytic Hierarchy Process (AHP)
The pairwise comparisons are made per hierarchy levels, and each stakeholder must compare and decide which factor is more important for each level, according to the Saaty scale 33 From these comparisons, positive reciprocal matrices are obtained. A Saaty matrix (Equation 1) is then created for each of the decision-makers, A k , where a ij is the result of the comparison between factor i and factor j of the hierarchy:
 ()1
()1
Using the matrices with the individual preferences, the priorities of each stakeholder are calculated (Equation 2) according to the different levels and following the eigenvector method (EM): weights vector is the eigenvector corresponding to the maximum eigenvalue of matrix A.
 ()2
()2
where
A = the preference matrix
W = the vector of priority or vector of weights
ƛ max = the maximum eigenvalue of the matrix.
Prioritization results can be seen in the following equation:
 ()3
()3
However, not all the comparison matrices can be included in the results. Firstly, preference consistency expressed by each decision maker is verified to confirm valid individual opinions for group priorities. This consistency can be checked through a consistency analysis, calculating the Saaty consistency index (CI) for each preference matrix (Equation 4).
 ()4
()4
The consistency ratio (CR) is calculated from CI and is defined as the CI to RI ratio:
 ()5
()5
where
RI = the mean CI value of the pairwise comparisons of randomly obtained matrices of the same order. For CR under 10% (0.1), the matrix is considered consistent.
Our analysis of the flower industry supply chain intends to identify the SC processes to be improved or redesigned according to performance attributes and the metrics used to measure each attribute. Figure 1 shows the level selection of the “to be redesigned processes”.
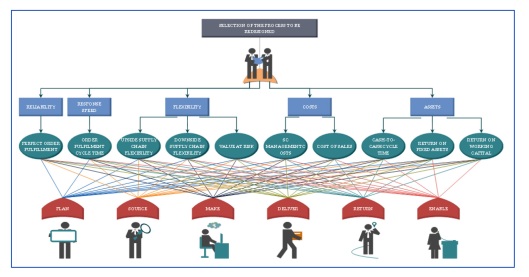
Source: Authors’, based on a proposal by Palma-Mendoza (2014). Fuente: Elaboración propia, basado en la propuesta de Palma-Mendoza (2014).
Figure 1: SCOR model mapping for redesigning processes. Figura 1: Mapeo del modelo SCOR para el rediseño de los procesos.
On the second level, performance attributes, followed by metrics for each attribute, and finally, on the lowest level, the model supply chain processes.
Finally, through the AHP analysis, each factor in the hierarchy is weighed. and the order of importance already established by the experts are clearly visualized. This makes it possible to identify those attributes, metrics, or processes that may initially have been less considered but, according to expert opinion, should receive greater attention.
Data on stakeholder preferences can be gathered through an online survey, using a specific digital questionnaire designed for this purpose. The questionnaire should be user-friendly and facilitate reflection and decision-making. Content, structure, and design are essential components, and the respondent should be able to answer individually and share his or her personal experience. Besides the questions, it should also include descriptions of decision-making in the floriculture sector, the AHP hierarchy, the Saaty scale, and how to make pairwise comparisons. Stakeholders are invited to share their expert opinion through the online survey 23.
Case study
Flower production in the Ecuadorian Pichincha and Cotopaxi provinces account for 83% of the production, with the largest number of flower companies. This study gathered, a group of experts in the flower industry representing the largest 100 Ecuadorian flower companies (order established based on the income data published by the Superintendencia de Compañías del Ecuador), accounting for approximately 80% of the industry’s turnover in 2019 2,8. The group was also integrated by academics from the Facultad de Administración de Empresas de la Universidad Central del Ecuador; government experts in floriculture from the municipality of Cayambe; and flower quality control specialists. All participants were given equal importance in the decision-making process 24.
A digital questionnaire gathered information on stakeholder preferences (https://docs.google.com/forms/d/1YzlailVXXF0xk4tURIM3v1GweL2oINS3RMh_WdG-7Q/edit?usp=drive_web).
The questionnaire was divided into four sections:
- The first section described objectives and requested information on company or institution identity. It also included information on the Ecuadorian flower sector, the Ecuadorian supply chain and the AHP hierarchy with the objective of redesigning elements, metrics, and processes. Finally, it added an explanation of the Saaty scale for comparisons.
- The second section listed 10 questions related to pairwise comparisons of the supply chain processes for rank determination.
- The third section presented questions regarding metrics for each attribute (7 questions).
- Finally, the fourth section included 10 questions about performance metrics relevance.
Results and discussion
Several authors have applied this approach. Specifically, in their study into the Turkish clothing industry, Aydın et al. (2014) used the SCOR levels as follows: Level 1 described model scope and content, and in level 2, the company’s supply chain was broken down into 26 process categories. The scope of the research focused on level 1 performance attributes and metrics. Meanwhile, Lhassan et al. (2018) considered level 1 as the strategic level at which the different supply chain processes and the role of the SC actors were defined. Among the actors considered were manufacturers, suppliers, wholesale distributors, and first and second-level customers. The distributing processes identified were plan, source, delivery, and return. At level 2, considered the tactical level, each level 1 process was broken down into two or more sub-processes. The questionnaire was sent to ninety-six companies, but only six answered with Hilsea Investments first in the ranking by income. In addition, answers were received from two academics, a local council official from Cayambe, and an expert in flower quality control for the Ecuadorian flower sector. A total of ten out of 100 submissions were answered.
The different stakeholder assessments showed coherence as well as acceptable consistency. Table 1 (page 78), presents level 1 weightings of the Ecuadorian flower supply chain.
Table 1: Level 1 metrics weights. Tabla 1: Pesos para las métricas de nivel 1.
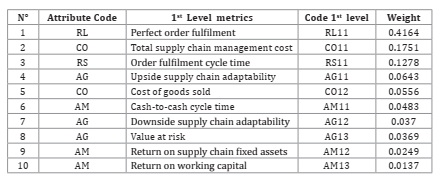
Source: Author calculations. *Attribute: Reliability (RL), Responsiveness (RS), Agility (AG), Cost (CO), Asset Management Efficiency (AM).
Fuente: Elaboración propia. *Atributos: Fiabilidad (F), Velocidad de respuesta (VR), Agilidad (AG), Coste (CO), Eficiencia en la gestión de activos (E).
Regarding the ten metrics proposed by the SCOR model, the results show that stakeholders considered the Perfect order fulfilment metric to be the most relevant, weighing 40%. Other significant metrics, albeit of less importance, are SC management cost, with 18%, and Order fulfilment cycle time, with almost 13%. The other seven metrics, only accounting for 29%, were considered unimportant by the experts. In decreasing order, these seven metrics are: Upside supply chain adaptability, Cost of goods sold, Cash-to-cash cycle time, Downside supply chain adaptability, Value at risk, Return on supply chain fixed assets, and Return on working capital.
Concerning the Upside supply chain adaptability metric, with 6% weight, the maximum period (for a company to adapt) suggested by the SCOR model, is 30 days. But in the case of the flower industry, this would be unfeasible, since depending on the species, it takes approximately twenty weeks for flowers to reach harvest time 11,13,22,34 and, therefore, any adjustment would need more time. The fact that the flower industry has a limited capacity to quickly react to changes in demand may well be the reason for the low weight given to this metric. However, considering the outlook for the flower industry, it does seem that the Ecuadorian floriculture sector should pay greater attention to this SCOR supply chain metric. This is given the growing demand already observed during the first months of 2021 (5% increase as compared to the same period in 2020)(37, and also increasing exports predicted by the International Association of Horticultural Producers (AIHP). This organization estimates that flower demand in China will reach EUR 100 billion by 2030 10.
In 2019 goods sold in the flower industry accounted for approximately 99% of the sales, one point higher than in previous years, whose average was 98% 2,8. These percentages leave companies very little room for manoeuvre when it comes to establishing new markets or pricing strategies. This would explain the weight given to this metric (5.6%), which ranked fifth among the ten metrics studied. Despite the apparent need to optimize processes and production costs in the Ecuadorian flower sector, to our knowledge, there is no state-of-the-art research on this issue.
The experts participating in this study attached little importance to the Cash-to-cash cycle time metric, with a weight of less than 5%, ranking sixth. However, if this metric were better managed, flower companies could obtain annual surpluses, enabling them to invest further and improve their yield and production management. Based on the financial statements of some of the companies 2,8, we estimated the cash-to-cash time cycle length at about 42 days. This is because the sum of the days of accounts receivable plus the days of inventory generates a relationship of 3 to 1 with the days of accounts payable. The average collection period was estimated at approximately 44 days. If this number of days were to be reduced to thirty, firms could then produce an annual surplus of up to USD 1,500,000 that could be invested in other asset types.
The SCOR model suggests 30 days for the Downside supply chain adaptability metric. As in the case of the Upside supply chain adaptability metric, the flower production system itself makes it challenging to meet these deadlines since the process cannot be suspended at short notice. Thus, the fact that this metric is difficult to manage and control may be the reason why it stands seventh with little attached importance.
The Value at-risk metric ranks eighth and is considered by floriculture organizations as part of the risk management function and not as a risk quantifying metric 32. Uncertainty is obviously inherent to the flower industry, making it extremely complicated for companies to forecast risks. From the flower companies’ financial statements (published by the Superintendencia de Compañías del Ecuador), it was estimated that industry yield risk was about 44% in the 2015-2019 period (Expected return, R ̅; standard deviation, σ; coefficient of variation, CV; CV= σ⁄R ̅). This clearly indicates high risk, given that in the Ecuadorian floriculture sector, as previously mentioned, yield with respect to income is about 1%.
The Return on supply chain fixed assets metric 21 barely represents 2% of the total weight. This low percentage is due to the reduced margin of these flower companies, which in turn is related to the supply chain assets, and as previously stated, the high cost of sales leaves these firms little room for manoeuvre.
Finally, the Return on working capital metric 36 ranks last in level 1. The metric value calculated from the aforementioned financial statements data (Superintendencia de Compañías del Ecuador) was 10% (Return of working capital=(Revenue-Costs)/ (Inventory+Accounts receivable-Accounts payable). This value is obtained after considering: (a) that the ratio between accounts receivable and inventory to the payable accounts is 3 to 1, and (b) given the reduced margin (1%) from the revenue minus total costs.
Table 2 offers both the calculated and the suggested performance weights of the Ecuadorian flower industry supply chain.
Table 2: Calculated vs. suggested weights for the performance attributes. Tabla 2: Pesos calculados vs. sugeridos para los atributos de desempeño.
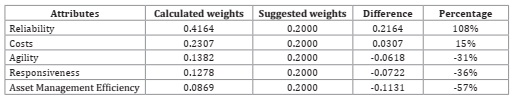
Source: Author calculations. * Calculated weight of the attributes - Suggested attribute weight = Difference = Gap.
Fuente: Cálculo de los autores * Peso calculado de los atributos - Peso sugerido de los atributos = Diferencia = Brecha.
Attributes with the largest gaps can be found in reliability, effective SC asset management, response speed, and flexibility.
Table 3 displays weights attributed to the six main supply chain processes (Plan, Source, Make, Deliver, Return and Enable).
Table 3: Process weight. Tabla 3: Pesos de los procesos.
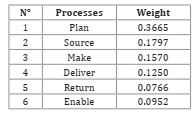
Source: Author calculations.
Fuente: Elaboración propia.
These results show that the return and enable processes have the lowest scores, and should, in consequence, be more attentively observed. The return process is carried out by the flower companies themselves, but not following SCOR recommendations. In fact, the participating Ecuadorian flower companies did not specify protocols in relation to product reverse flow, nor did they indicate any aspects associated with return delivery scheduling, shipment and reception, all of which should be considered in the return process according to the SCOR model.
The enabling process showed the lowest weight, meaning no activity related to the SC management is carried out as recommended by SCOR. This implies no monitoring of trade rules, performance, data processing, resources, facilities, contracts, network supply chain, rule compliance, risks, or procurement.
Conclusions
We conclude that using both the SCOR model and AHP may not only constitute an appropriate methodology supply chain analysis of the floriculture sector but may also be applied to any other producing sector. To date, few research articles have combined the application of the SCOR and AHP methods to the agricultural sector.
The SCOR model permits to map and describe the supply chain, and along with experts and the AHP technique, identify and redesign those crucial chain aspects.
Performance attributes and metrics of the SCOR model cover all possible metric combinations measuring supply chain performance. Best practices recommended by SCOR apply to any supply chain structure.
In this study, level 1 metrics, SCOR attributes and all processes defined, were analyzed through surveys. Based on the pairwise comparisons in AHP, experts identified the most critical performance aspects needing to be redesigned.
According to the results obtained, improvements should focus on those lower-weighted aspects by applying the best SCOR practices. Concerning metrics, those to be improved are increasing and decreasing the supply chain adaptability, cost of sold goods, cash-to-cash cycle time, value at risk, return on supply chain fixed assets, and return on working capital. As for the attributes, the following need to be upgraded: reliability, supply chain asset management, responsiveness, and agility. Finally, regarding the processes, adjustments should focus on the return and enable (management) processes.
It is suggested that representatives of the Ecuadorian flower industry adopt the following measures: (a) continuous monitoring of demand behaviour, (b) reduction in the cost of sales share with respect to income, (c) reduction in number of days of receivable accounts and inventory, (d) risks monitoring risk management tools usage, (e) fixed assets usage optimization, and (f) reverse logistics application.
Several Ecuadorian flower companies took part in our study. But the participation of the flower export trade association as a whole, together with a larger number of Ecuadorian flower companies, could help obtain a more complete picture in future studies. Furthermore applying other approaches, such as business process reengineering (BPR) could help redesign processes.

