


Services on Demand
Journal

Article
 English (pdf)
 Article in xml format
 Article references
 Send this article by e-mail
Indicators
-
 Cited by SciELO
Related links
-
 Similars in
SciELO
Similars in
SciELO
Share

 Permalink
Estudios económicos
On-line version ISSN 2525-1295
Estud. econ. vol.36 no.72 Bahía Blanca Jan. 2019
Farm management systems: technical efficiencies differences and technology gap of Uruguay's dairy farms° °°
Los sistemas de gestion predial: diferencias en eficiencia tecnica y brechas tecnologicas en los tambos de Uruguay
Federico García Suárez* - Gabriela Pérez Quesada*
* Universidad de la República, Facultad de Agronomía. Correo electrónico: fgarcia@fagro.edu.uy; gperezquesada@fagro.edu.uy
enviado: 16 julio 2018
aceptado: 29 de octubre 2018
Abstract
This study analyzes technological differences between two groups of dairy farms in Uruguay, family and business-managed. The meta-frontier methodology is applied to estimate and compare technical efficiencies between these two groups. Although business-managed farms are more technically efficient than family farms (0.702 and 0.487, respectively) both groups of farmers could obtain productivity gains improving their technical efficiency. Moreover, the two groups are operating under different technology conditions. The estimated average meta-technology ratio for BMF is 0.911 and 0.807 for FF. Therefore, BMF should adopt and invest in new technologies to shift the production function upward and reduce the technology gap while FF could try to implement the prevailing practices that are being used by BMF.
JEL Code: Q12, D24, C23.
Keywords: Technical Efficiency; Technology Gaps; Meta-Frontier; Dairy Production.
Resumen
El presente estudio analiza las diferencias tecnológicas entre dos grupos de productores de leche, familiares (PF) y con manejo empresarial (PME). Para obtener estimaciones de eficiencia técnica comparables entre los dos grupos se utiliza la metodología de meta-fronteras. Aunque los PME son técnicamente más eficientes que los PF (0.702 y 0.487, respectivamente) ambos grupos podrían obtener un mayor nivel de productividad mejorando su eficiencia técnica. Además, cada uno de los grupos opera bajo diferentes condiciones tecnológicas. El valor promedio del meta-ratio es 0.911 para los PME y 0.807 para los PF. Por lo tanto, los PME deberían invertir en nuevas tecnologías para reducir la brecha tecnológica, mientras que los PF podrían implementar las prácticas y tecnologías prevalecientes que están siendo usadas por los PME.
Código JEL: Q12, D24, C23.
Palabras clave: Eficiencia Técnica; Brechas Tecnológicas; Meta-frontera; Producción de Leche.
INTRODUCTION
The productive structure of the dairy sector in Uruguay has experimented with important changes generating a remarkable dynamism. The pastoral extensive model of production, based on natural conditions, evolved into intensive farming based on cultivated pastures and a higher supply of better quality feed. Therefore, milk production reached a sustained growth that can be explained by gains in productivity, which allowed Uruguay to become more competitive in international markets.
This process of transformation implied a continuous increase in the process of technology adoption, management and organizational changes. However, the sector must deal with important challenges to successfully satisfying the increasing global demand and maintaining a place as a competitive producer of milk among subsidized dairy producers in other countries. Moreover, dairy farms compete for the available inputs -land or labor, with other activities such as rangeland cattle and agriculture production. Consequently, farmers have to produce more milk and increase their efficiency and productivity. Hence, an important issue in dairy farming production is how to increase milk production using more efficiently the available resources and technology.
Technological improvements adopted by dairy farms have been key to overcome the own sectors' difficulties and those that have been mainly imposed by the international market requirements. However, there exist evidence that the incorporation of technology has been asymmetric among farmers (Chaddad, 2009). Besides, this process of transformation and technology adoption requires higher levels of investments, which has led to the exit of family farms. According to Mondelli et al. (2013), the size of a farm is a restriction to the adoption of new technologies, particularly to the adoption of new production methods, new input combinations, or to significant changes in the organizational structure. The intensification of production processes implied, for many farmers, an increase in the scale of production (Hernandez, 2011).
Consequently, farmers with high and low levels of productivity and technology adoption might co-exist in Uruguay, indicating that the adoption of new technologies has been heterogeneous among farmers. The low agricultural productivity level can be explained by many reasons such as limited knowledge about productivity-enhancing production methods and productive technologies, limited availability of productivity-enhancing inputs or limited access to credit (Henningsen, Mpeta, Adem, Kuzilwa and Czekaj, 2015).
In this context, one question that arises is how dairy farmers could increase productivity and efficiency, and whether they share the same technology. If the production technology is heterogeneous, the efficiency measures should consider this heterogeneity to obtain an accurate and comparable assessment of farmers' performance. According to O'Donnell, Prasada Rao and Battese (2008) firms in different groups -regions, industries, countries, face different production technology because of differences in the characteristics of the physical, social, and economic environment where production takes place. These different conditions in the production environment affect technical efficiency and the analysis under the same production frontier result inaccurate.
The principal objective of this study is to analyze technological differences between two groups of farmers, defined as family farmers (FF) versus business-managed farmers (BMF), and obtain estimates of relative technical efficiencies. Achieving a higher level of knowledge about technological gaps between these two groups is relevant for Uruguay since specific policies have been developed for family farmers.
Assuming family farmers face restrictions accessing resources, like physical or financial capital we hypothesized that the adoption of new technologies is more restricted for the FF than for BMF, which results in different milk production environment. We implemented a meta-frontier methodology introduced by Battese and Prasada Rao (2002), refined by Battese, Prasada Rao and O'Donnell (2004) and then by O'Donnell et al. (2008) that allows us to compare the technical efficiency of dairy farms if they are operating under different technologies. We use a balanced panel data containing information of dairy farms for two agricultural years, including a total of 218 observations per year.
A few studies have applied the meta-frontier approach to compare technical efficiency and technology across groups using farm level data and using formal statistical tests to determine technologies differences. Chen and Song (2008) used the meta-frontier methodology to analyze technical efficiency and technology gap in China's agriculture. Moreira and Bravo-Ureta (2010) compared technically efficiency for dairy farms in Argentina, Chile, and Uruguay using the meta-frontier approach. Rao, Brümmer and Qaim (2012) estimated meta-technology ratios and technical efficiency score for two groups of vegetable farmers in Kenya. Gatti, Lema and Brescia (2015) applied stochastic meta-frontier methodology to obtain estimates of relative efficiency in beef cattle production for different regions of Argentina. Henningsen et al. (2015) used a meta-frontier to estimate the effects of contract farming on the farms' meta-technology ratio, their group technical efficiency, and their meta-technology technical efficiency using a data set from sunflower farmers in Tanzania. Technological differences between New Zeland North Island and South Island dairy farms were analyzed by Jiang and Sharp (2015) using the stochastic meta-frontier model. Finally, Villano, Bravo-Ureta, Solís and Fleming (2015) estimated meta-frontiers to analyze productivity differences between adopters and non-adopters of modern rice technologies in Philippines. Finally, Donnet, López, Black and Hellin (2017) use the meta-frontier methodology to analyze the differences in productivity between farmers participating in MasAgro program and the average farmers in seven defined rain-fed maize regions in Mexico.
The rest of the paper is organized as follows. Section I describes the stochastic meta-frontier methodology. Section II presents the data and the empirical model. Empirical results and analysis are reported in section III. The last section contains the conclusions of this study.
I. METHODOLOGICAL FRAMEWORK
The meta-production function was first introduced by Hayami (1969) and Hayami and Ruttan (1970, 1971), and defined as an envelope of commonly neoclassical production functions. This concept of meta-production function assumes that all firms of different groups potentially have access to the same technology. However, firms in different groups operate under different technology production opportunities because of differences in available stocks of physical, human and financial capital (O'Donnell et al. 2008). In this case, is not possible to make efficiency comparisons across groups.
Battese and Prasada Rao (2002) presented a stochastic meta-frontier (MF) model in order to provide comparable technical efficiency scores for firms across groups having different technologies. However, this procedure does not necessarily result in an estimated MF function being an envelope of the estimated individual production frontiers for the different groups. Therefore, Battese et al. (2004) refined this model to guarantee that the MF envelops the separate stochastic production frontiers for the different groups considered. Finally, O'Donnell et al. (2008) presents the theoretical framework for definition of MF and explains how MF can be estimated using non-parametric and parametric approaches.
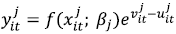
Following Battese et al. (2004), separate stochastic production frontiers (SPF) are defined for each group of firms in a given industry. If there exists data for firms in each group, a stochastic frontier model proposed independently and simultaneously by Aigner, Lovell and Schmidt (1977) and Meeusen and van den Broeck (1977) can be defined as:
 | (1) |
where  is the output for the ith firm in the tth time period for the jth group
  is a vector of inputs used by the firm, and (βj) denotes the vector of frontier parameters to estimate for each group. The random error
  is assumed to be distributed independent and identical following,
  and independent of the term
  which is the non-negative random error that captures technical inefficiency. It can follow different distributional forms, being the most common the truncated normal and the half-normal distribution. A more detailed analysis of inefficiency error term distributional forms can be found in Kumbhakar and Lovell (2000).
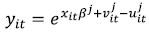
Under the assumption that the exponent of the SPF is linear in the parameter vector βj, so that xit is a vector of functions of the inputs, the technology can be represented by a Cobb-Douglas or Translog as commonly used functional forms, and the model (1) can be expressed as:
 | (2) |
For simplicity, we omitted the subscript jth on the input and output variable. Maximum likelihood (ML) method is used to estimate the frontier parameters in equation (2) assuming that uit is uncorrelated with the regressors and with the vit. Following Battese and Corra (1977) the log-likelihood function is parameterized in terms of the variance ratio  , where
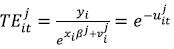
  . The variance ratio γ reflects which part of the total variance in the model is attributed to technical inefficiency variance, and it ranges between 0 and 1. In order to obtain an estimation of firm-specific technical efficiency (TE) in the tth time period for the tth group, we follow the approach proposed by Jondrow, Lovell, Materov and Schmidt (1982), and generalized to panel data models by Battese and Coelli (1988). Therefore, TE relative to the stochastic frontier for the group is:
 | (3) |
After the estimation of the individual SPF (2) for each group, it is important to analyze if all the firms share the same technology. In this case, there no exists a reason for estimating the firms TE levels relative to the MF function (Battese et al., 2004). A likelihood ratio test (LR) can be applied to verify if the groups share the same technology, where L(H0) is the log-likelihood function for the stochastic frontier estimated by pooling the data for all groups and L(H1) is the sum of the values of the log-likelihood functions from the individual production frontiers1.
The meta-frontier model is defined by Battese et al. (2004) as a deterministic parametric frontier under the restriction that the predicted value for the MF is larger than or equal to the predicted value from the SPF for all firms, groups and time period. Hence, the MF can be represented as:
 |
where  is the MF output and β* is the vector of parameters for the MF function such that:
 | (4) |
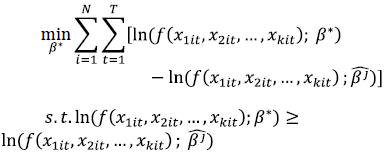
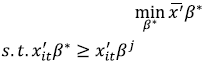
The constraints given by equation (4) means that the MF function cannot fall below any of the individual group frontiers (O'Donnell et al. 2008). To obtain estimates for the MF parameters the following linear programming (LP) problem is solved using the pooled data set which includes all observations for all groups:
 | (5) |
Since the estimated coefficient vector  for each group and the input vectors are fixed for the problem in (5), and if the function f(.) is log-linear in the parameters, an alternative way of representing the LP is:
 | (6) |
where  is the arithmetic average of the xit vectors, over all ith firms in all tth periods for the jth group. A more detailed explanation of this LP problem can be found in Battese et al. (2004). Bootstrapping methods can be used to obtain standard errors for the MF parameters estimates.
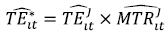
The following step, once the LP problem in (6) is solved, is to obtain estimates of meta-technology ratios (MTR) and TE with respect to the MF using the following decomposition of equation (2):
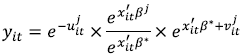 |
where the first term on the right-hand side is firm TE with respect to the group-j frontier represented by equation (3). The second term is the MTR for each firm in the jth group:
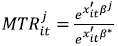 | (7) |
The MTR represents the difference between the technology available to firms in jth group relative to the technology available to all groups taken together. Because of the constraints in equation (4) the MTR lies between 0 and 1. According to O'Donnell et al. (2008) an increase in the MTR means that the gap between the jth group frontier and the MF is decreasing. Finally, TE of the ith firm in the tth time period with respect to the MF is:
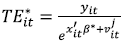 | (8) |
As the MF envelops the group frontiers, efficiency estimates with respect to the MF  can be decomposed into two terms:
  that represents firm efficiency measured relative to the group frontier, and
  that measures the distance between the group frontier and the MF representing technology differences in the production environment (O'Donnell et al. 2008):
 | (9) |
where and are the estimation obatined from equations (3) and (4), respectively. All the parameters estimate where calculated using the software package Frontier for R.
II. DATA AND EMPIRICAL MODEL
We use a balanced panel data containing information of dairy farms for two agricultural years, including a total of 218 observations each year (62 FF and 156 BMF). The data for the first agricultural year (2010-11) come from the General Agricultural Census carried out in 2011. Data for the second agricultural year (2013-14) was collected in a survey conducted by the National Institute of Milk (INALE) in 2014.
Three variables were used to define the groups: total land, hired labor and main source of income. Family farms' group includes those farms which have until 500 ha, hire 2 employees as maximum and milk production is the main source of income. Descriptive statistics for the principal variables for each group and year is presented in table 1. As we can see from the means and standard deviations, there exist differences among FF and BMF. On average, the productivity per cow and per hectare is higher for BMF than for FF which implies that BMF obtain a better performance. On the other hand, the number of cows per hectare is higher in the FF group than in BMF group. This can be explained because we are using the total land available for production, not only for milk production, and BMF are larger than FF (table 1). Also, it is usual that smaller dairy farms take the calves out of farm, doing back-grounding in cooperative fields. Larger farms usually have the back-grounding in farm.
Table 1. Summary statistics of variables by group and year
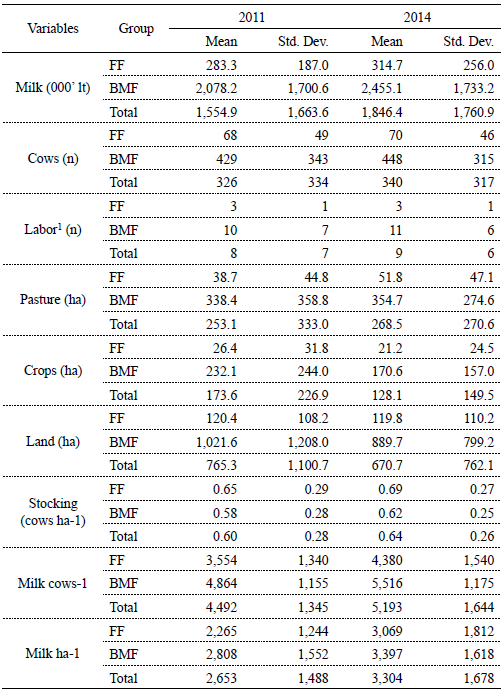
1 Includes family and hired labor. Source: own elaboration.
We first estimated a stochastic production frontier for FF and BMF, and the Cobb-Douglas technology representation is:
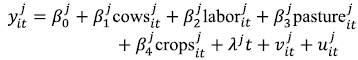 |
where the same variables are used in both models. The dependent variable  represents the total milk produced for the farm in the period in the group. We include four explanatory variables to define the production frontier: the total number of milking cows (cows), the total number of employees including family and hired labor (labor), the total area under artificial grassland (pasture), and the total area cultivated for forage production (crops). In addition, a tendency variable is included to capture technological change.
As we are using a panel data, technical efficiency changes over time should be considered in our models. Following Battese and Coelli (1992) the inefficiency term is treated as time-variant depending on specific function as follows:
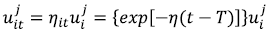 |
Inefficiency variation comes from the interaction between time and an unknow parameter (η). The sign of η defines the efficiency variation, if η is positive this means that TE is increasing along time, η is equal zero means no change in efficiency, and if η is negative TE decreases over time.
According to Kumbhakar, Line and Hardker (2012) this model is restrictive since the inefficiency varies over time following an exponential function. An alternative model is proposed by Battese and Coelli (1995) where the inefficiency term is defined by a function of exogenous and firm specific variables that might explain the inefficiency variation. In the present study we do not have suitable variables to appropriately model the inefficiency term. Moreover, it is important to note that these two models presented by Battese and Coelli are unable to distinguish between firm effects and inefficiency. Green (2005a) and Green (2005b) proposed two alternative models, 'true fixed' and 'true random' effects frontier models, which overcome this limitation. Considering the model specification and estimation results from each group, we estimate the meta-frontier by solving the problem defined in (6).
III. EMPIRICAL RESULTS AND ANALYSIS
III. 1. Production frontier estimates by group and the meta-frontier
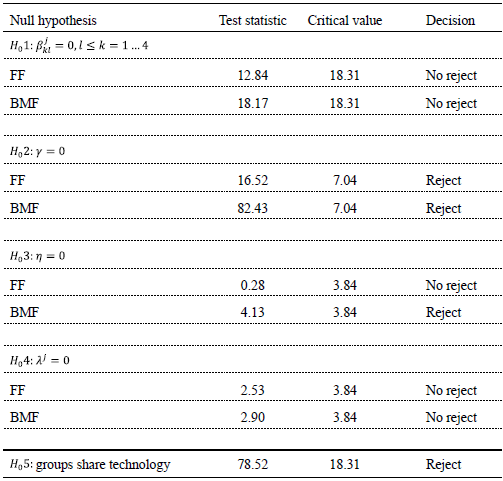
A series of specification test were implemented to obtain a model specification that correctly represents our data in each group. As we implement a parametric model, a specific functional form is required to reflect the production technology. A Translog functional form is compared with a Cobb-Douglas which is a more restrictive specification. A LR test is used to select the appropriate form. We cannot reject the null hypothesis  at the 5% level of significance meaning that the Cobb-Douglas form is more suitable than the Translog for our data in each group (table 2).
Table 2. Likelihood ratio tests for group production frontier (5%)
Source: own elaboration.
Concerning to the relevance of inefficiency to explain the total variance of the model we test if technical inefficiency is not present in the model in which case the estimation results are equivalent to an OLS estimation. Under the null hypothesis (H02: γ = 0) the test statistic follows a mixed χ2-distribution (Coelli, 1995), and critical values can be obtained from Kodde and Palm (1986). The null hypothesis was rejected for the two models as table 2 shows. This result implies that inefficiency is important for explaining deviations from the production frontier in our two models.
We test if technical efficiency increases, remains constant or decreases over time, comparing the time variant efficiency model proposed by Battese and Coelli (1992) with a time invariant model. The null hypothesis that technical efficiency is time invariant (H03: η = 0) cannot be rejected at the 5% level of significance for the FF model. On the other hand, the time-variant efficiency model is suitable for the data when we consider BMF group (table 2).
The assumption of time invariance of technical efficiency has been questioned, especially in long panels. Although our empirical application is based on a very short panel data that only includes two agricultural years, we estimate time-variant models following the specification obtained for BMF. This is because BMF are more likely to define the potential technology available for the whole dairy sector, leading the adoption of new technologies, while family farmers face more restrictions in the implementation of these new techniques which might affect their technical ability to combine inputs to obtain the maximum output.
A tendency variable is included in the models to capture technological change. The null hypothesis that technological change is not significant in the model specification (H04: λ = 0) is not rejected at the 5% level of significance for both models. However, the null hypothesis is rejected at the 10% level of significance for BMF model (table 2). Based on the fact that dairy sector is dynamic, and it has undergone a continuous process of technology adoption we decided to include the tendency variable to consider technological change.
Finally, we tested if groups share the same technology, i.e. if the parameters of each group frontiers are the same as the meta-frontier parameters (H05). We rejected the null hypothesis of groups having the same technology (table 2).
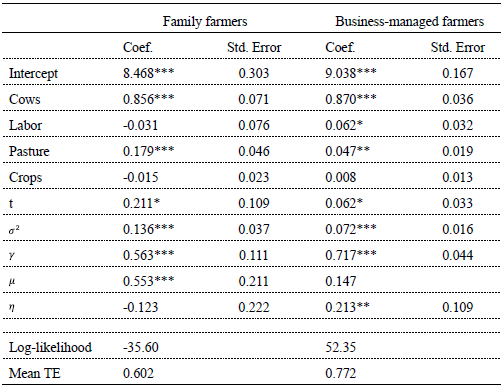
Table 3 includes the estimates for the Cobb-Douglas stochastic production frontier for each group. The estimated γ parameter in FF and BMF models confirms that both statistical noise and inefficiency are important for explaining deviations from the production frontier. Of all input variables, the number of milking cows has the highest effect on milk production level with elasticity equal to 0.856 and 0.870 for FF and BMF models, respectively. This finding is consistent with other studies that estimate stochastic production frontiers for dairy farms including Kompas and Che (2006), Cabrera, Solís and del Corral (2010) and Moreira and Bravo-Ureta (2010). The total area under artificial grassland is significant for both models but it has a higher effect for FF meaning that FF's production system is more extensive comparing with BMF.
Table 3. Stochastic production frontier estimates for FF and BMF
*** 1% level significance, ** 5% level significance, * 10% level significance
Source: own elaboration.
Technological change is positive and significant at the 10% level of significance for family farms. However, the efficiency is not significant meaning that it remains constant over time. Therefore, family farmers achieved improvements in the output that arise from the adoption of new production technologies rather than improvements in their managerial ability or technical efficiency.
In the business-managed farms model, we found that technological change is also positive and significant at the 10% level of significance. Moreover, technical efficiency increased over time. These findings reflect that BMF not only incorporated new technology but also, they improved their technical ability to combine the available inputs to obtain a larger output.
Mean technical efficiency level is 0.602 and 0.772 for FF and BMF, respectively, indicating that they are not fully technical efficient and that on average FF reached 60.2% of their technical abilities while BMF reached 77.2%. However, these two scores are not comparable if FF and BMF are operating under different technologies. Therefore, we test the null hypothesis that the two groups of dairy farms share the same technology. As commented previously, using a LR test (table 2) we reject the null hypothesis at the 5% significance level. This result means that FF and BMF face different stochastic production frontiers. As consequence, to compare technical efficiency scores between the groups we estimate a meta-frontier instead of a pooled stochastic frontier. The meta-frontier envelops the deterministic component of the group frontiers.
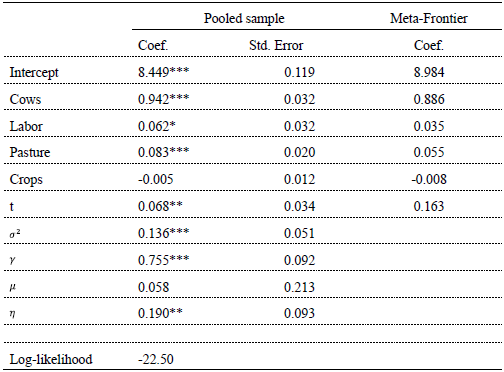
Model selection for the pooled sample is made on the basis of the previous results obtained for each group. As BMF are more likely to define the potential technology available for the whole dairy sector, we decided to use the BMF model's specification to estimate the pooled stochastic frontier. Table 4 shows the estimates of parameters of the pooled stochastic frontier and meta-frontier production function.
Table 4. Stochastic production frontier estimates for the pooled sample and the meta-frontier
*** 1% level significance, ** 5% level significance, * 10% level significance
Source: own elaboration.
III. 2. Technical efficiencies and meta-technology ratios
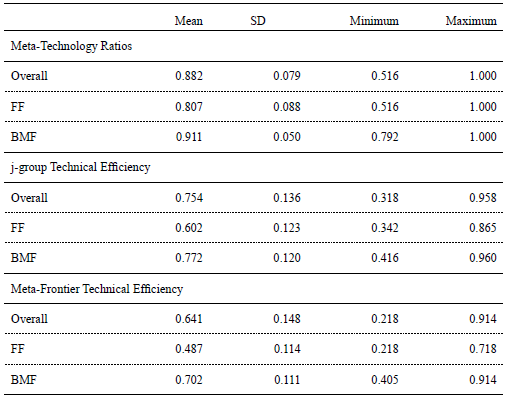
Estimated MTR, technical efficiency obtained from each group's stochastic frontier (TE) and from the meta-frontier (TE*) are presented in table 5. As we mentioned before, an increase in the MTR means that the gap between the group frontier and the MF is decreasing (O'Donnell et al., 2008). A value of 1 implies that the group frontier coincides with the MF.
Table 5. Summary statistics of TE and MTR estimates
Source: own elaboration.
The average estimated MTR for FF is 0.807 ranging from a minimum of 0.516 to a maximum of 1, whereas for BMF the average estimated MTR is higher and equal to 0.911. The gap between the MF and the FF group frontier is higher than the gap between the MF and BMF group frontier. Therefore, the maximum output that could be obtained by FF and BMF, given the available inputs, is 80.7% and 91.1%, respectively, of the potential output that is defined by the meta-frontier. This result supports our hypothesis that family farmers face more restrictions accessing resources, like physical or financial capital, and as consequence the adoption of new technologies is more limited compared with BMF. Hence, the technology available for FF is below the technology available for BMF. However, both FF and BMF could obtain productivity gains from adopting new technologies that shift individual frontiers towards the MF.
To calculate technical efficiencies with respect to the MF we use the equation (9) defined in the methodology section. The MF estimate generates a common technology which enables the direct comparison of TE across the two groups. The BMF have an average TE* of 0.702 while average TE* for FF is 0.487. FF are more technically inefficient than BMF, and they could obtain productivity gains by adjusting their current inputs' management.
Figures 1 and 2 show that farmers with higher levels of technical efficiency reach on average higher partial productivity, measured as liters of milk per cow. In 2011, FF obtain on average 3,554 liters per cow while BMF obtain 4,864. Average TE* is 0.480 for FF and 0.721 for BMF.
Figure 1. Meta-frontier technical efficiency and liters per cow 2011
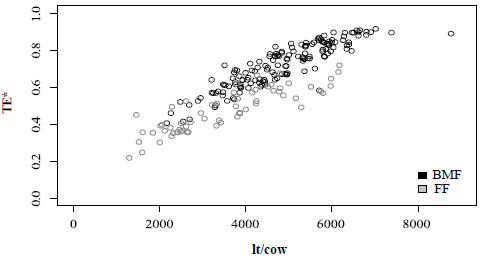
Source: own elaboration.
Figure 2. Meta-frontier technical efficiency and liters per cow 2014
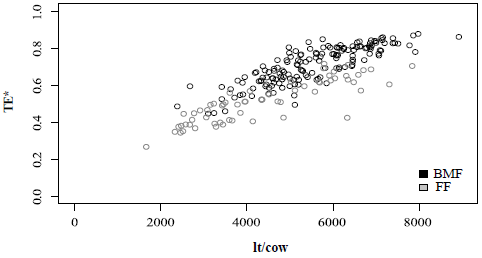
Source: own elaboration.
In 2014, FF and BMF achieved higher average productivity levels than in 2011 (4,380 and 5,516, respectively). Also, farmers that are more technically efficient produce more liters of milk per cow than those less efficient. Regarding to TE* levels, FF present an improvement in their efficiency (0.495) while average TE* for BMF is lower than in 2011 (0.684). As we saw, BMF obtain an efficiency gain in 2014 considering their own frontier. Therefore, what can be explaining the lower TE* is that the gap between BMF's frontier and the meta-frontier is on average higher in 2014. This finding reflects that BMF should adopt new technology to shift their frontier upward.
As we can see the meta-frontier analysis divides the production efficiency in two parts: the inefficiency relative to each group and the technology gap between the group frontier and the MF. As consequence, farmers could achieve higher production efficiency increasing their technical abilities and/or adopting new technologies to reduce technology differences in the production environment. Family farmers could improve their performance using the current level of inputs and production technology available, and they also could try to implement the prevailing practices that are being used by BMF as the following tables show.
The amount of concentrated feed and forage used to produce a liter of milk, and to feed a milking cow is higher for BMF (table 6). Therefore, the use of supplementary feed might allow family farmers to improve their performance closing the gap with BMF.
Table 6. Average value of feed per liter and milking cow (kg/cow)

Source: own elaboration.
Most of the BMF receive permanent technical support from agronomists or veterinaries who support them to successfully implement practices to increase the output in an efficient way. On the other hand, we can see that only 48% of FF receive professional assistance (table 7). Agronomic or veterinary advise, gives support to the management of the dairy system allowing the farmer to discuss decisions and practices with a professional. The difference between groups might be explained mainly by the cost of hiring a professional relative to the size of the farm, which might be a reason for FF to have less assistance.
Table 7. Percentage of farms with permanent veterinary or agronomy assistance
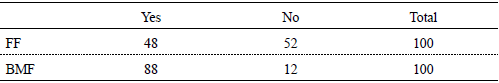
Source: own elaboration.
Table 8 shows that accounting assistance is also very important for BMF. The percentage of BMF who receive permanent accounting assistance reaches 89% while for FF it is only 32%. Hence, FF could improve their performance and production efficiency if they receive not only more veterinary or agronomic assistance, but also accounting assistance that allows them to make better decisions about the productive process and its organization. Again, the most important restriction that FF face to access to accounting assistance seems to be the cost of hiring qualified labor.
Table 8. Percentage of farms with permanent accounting assistance
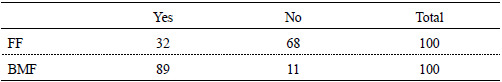
Source: own elaboration.
Artificial insemination also appears as a technique that FF should implement to obtain better results. Although more than 50% of FF are using artificial insemination, this percentage is still low compared with the proportion of BMF which are using this practice (95%) (table 9). The use of artificial insemination also could reflect that BMF presents more qualified management abilities than FF since farmers are required to have some specific knowledge about this technique to implement it successfully. The use of natural insemination has also an impact on production since the bulls requires a grazing area. Usually, when artificial insemination is well performed it results in lower calving interval. Hence, using bulls add complications on the herd management.
Table 9. Percentage of farms using artificial insemination

Source: own elaboration.
By definition BMF are larger in terms of land used for milk production than FF. However, we analyzed if the size of the farms also might be considered as a factor that affects farmers' performance. BMF who are more efficient show an average land used for milk production of 540 ha, while the average land for FF is 93 ha. To better understand if the differences in size affects efficiency, we divide FF and BMF into two groups according to the level of technical efficiency with respect to the MF. We find that there are not significant differences between the most efficient BMF as table 10 shows.
Table 10. Average land for milk production by group and TE*
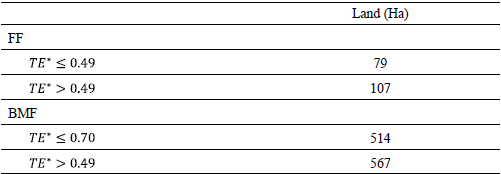
Source: own elaboration.
On the other hand, the most efficient FF are on average larger in terms of land used for milk production compared with less efficient FF. However, there not exist a strong and clear correlation between size and TE* (figure 3).
Figure 3. Metafrontier TE and land for milk production for FF by level of efficiency
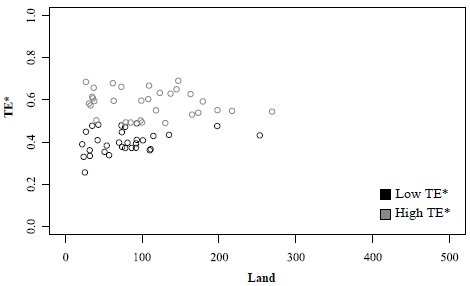
Source: own elaboration.
It is important to note that even though BMF are technically more efficient than FF, they are not fully technically efficient. Therefore, they could increase milk production if they implement more efficient farm practices. Moreover, they should adopt and invest in new technologies to reduce the technology gap between their individual frontier and the meta-frontier and improving the sector's performance as a whole.
These findings are relevant for policy makers designing programs which should consider technical efficiency and technology gap measures. Differences in technical efficiency as we found between FF and BMF show that there exist managerial and technical abilities gap. Therefore, it seems important to design policies focused on improving the ability of farmers to use new techniques and combine inputs, and not only focused in the size of farms. Achieving an accurate manage of supplementary feed appears as an important factor to increase efficiency. Moreover, policies focused on giving more technical assistance, agronomic, veterinary and/or accounting, could allow farmers make better decisions based on more qualified information. Therefore, technical assistance should focus on nutritional and reproductive management (artificial insemination) as those appears as the main drivers of technical efficiency differences.
On the other hand, differences in technology implies that new technologies should be adopted to shift the production function upward and reduce the limitations of the production environment. Therefore, government programs should also be focused on giving incentives to FF to adopt appropriate techniques for this group to reduce the technology gap and increase their productivity. Moreover, BMF who are closer to the MF, should have incentives to invest in new technologies to increase their productivity and maintain their role as producer of milk in the international markets.
CONCLUSION
This study analyzes technological differences between two groups of dairy farmers in Uruguay, family and business-managed farms. Meta-frontier approach was implemented using a balanced panel data including 218 observations per year.
Cobb-Douglas stochastic production frontiers were estimated for each group and for the pooled data. As we reject the null hypothesis that farms from both groups share the same technology, we estimated a meta-frontier to compare technical efficiencies between the two groups.
Technical efficiency obtained from group specific frontier and from the MF show that significant productivity's improvements could be achieved by dairy farms using the current level of inputs and the technology available. Mean technical efficiency level from individual frontier is 0.602 and 0.772 for FF and BMF, respectively, indicating that they are not fully technical efficient and that on average FF reached 60.2% of their technical abilities while BMF reached 77.2%.
Considering technical efficiency from the meta-frontier we find that BMF are on average more efficient than FF (0.702 and 0.487, respectively). FF show larger inefficiencies than BMF allowing for improvements in productivity from better allocation of inputs rather than adopting new technology. Moreover, the average estimated MTR for FF is 0.807, whereas for BMF the average estimated MTR is higher and equal to 0.911. This result means that BMF are closer to the MF and the technology gap is smaller comparing with FF. Therefore, FF could also improve their performance trying to implement the prevailing practices that are being used by BMF.
Finally, the empirical results in this study can be used to improve the public programs and policy design. Technology and managerial differences should be considered for policy makers to design more accurate programs and policies for each group. It has been common that policy making, and technological research treats both FF and BMF as groups only different by size. However, our findings show that policy making for FF should focus on management by giving technical support in order to improve nutritional and reproductive practices.
Notas
° García Suárez, F., & Pérez Quesada, G. (2019). Farm management systems: technical efficiencies differences and technology gap of Uruguay's dairy farms. Estudios económicos, 36(72), 91-115.
°° uthors are alphabetically listed. Co-authors with the same level of responsibilities on authoring the paper.
1 The test statistic  where L(H1) and L(H0) the log-likelihood values under the alternative and the null hypothesis, respectively, follows the χ2-distribution with degrees of freedom equal to the number of restrictions imposed.
REFERENCES
1. Aigner, D., Lovell, C. A. K., & Schmidt, P. (1977). Formulation and estimation of stochastic frontier production function models. Journal of Econometrics, 6(1), 21-37. [ Links ]
2. Battese, G. E., & Coelli, T. J. (1988). Prediction of firm-level technical efficiencies with a generalized frontier production function and panel data. Journal of Econometrics, 38(3), 387-399. [ Links ]
3. Battese, G. E., & Coelli, T. J. (1992). Frontier production functions, technical efficiency and panel data: with application to paddy farmers in India. Journal of Productivity Analysis, 3(1), 153-169. [ Links ]
4. Battese, G. E., & Coelli, T. J. (1995). A model for technical inefficiency effects in a stochastic frontier production function for panel data. Empirical Economics, 20(2), 325-332. [ Links ]
5. Battese, G. E., & Corra, G. S. (1977). Estimation of a production frontier model: with application to the pastoral zone of eastern Australia. Australian Journal of Agricultural Economics, 21(3), 169-179. [ Links ]
6. Battese, G. E., & Prasada Rao, D. S. (2002). Technology gap, efficiency, and a stochastic metafrontier function. International Journal of Business and Economics, 1(2), 87-93. [ Links ]
7. Battese, G. E., Prasada Rao, D. S., & O'Donell, C. J. (2004). A metafrontier production function for estimation of technical efficiencies and technology gaps for firms operating under different technologies. Journal of Productivity Analysis, 21(1), 91-103. [ Links ]
8. Cabrera, V. E., Solís, D., & del Corral, J. (2010). Determinants of technical efficiency among dairy farms in Wisconsin. Journal of Dairy Science, 93(1), 387-393. [ Links ]
9. Chaddad, F. R. (2009). El sector lechero en Uruguayo en un contexto internacional: organización y estrategia sectorial. Informe técnico. Ministerio de Ganadería Agricultura y Pesca del Uruguay-FAO. [ Links ]
10. Chen, Z., & Song, S. (2008). Efficiency and technology gap in china's agriculture: a regional meta-frontier analysis. China Economic Review, 19(2), 287-296. [ Links ]
11. Coelli, T. J. (1995). Estimators and hypothesis tests for a stochastic frontier function: a Monte Carlo analysis. Journal of Productivity Analysis, 6(3), 247-268. [ Links ]
12. Donnet, M.L, López, I.D, Black, J.R, & Hellin, J. (2017). Productivity differences and food security: a meta-frontier analysis of rain-fed maize farmers in MasAgro in Mexico. AIMS Agriculture and Food, 2(2), 129-148. [ Links ]
13. Gatti, N., Lema, D., & Brescia, V. (2015). A meta-frontier approach to measuring technical efficiency and technology gaps in beef cattle production in Argentina. In W. Martin (President), International Conference of Agricultural Economists, Milan: International Agricultural Economists Association. [ Links ]
14. Green, W. (2005a). Fixed and random effects in stochastic frontier models. Journal of Productivity Analysis, 23(1), 7-32. [ Links ]
15. Green, W. (2005b). Reconsidering heterogeneity in panel data estimators of the stochastic frontier model. Journal of Econometrics, 126(2), 269-303. [ Links ]
16. Hayami, Y. (1969). Sources of agricultural productivity gap among selected countries. American Journal of Agricultural Economics, 51(3), 564-575. [ Links ]
17. Hayami, Y., & Ruttan, V. W. (1970). Agricultural productivity differences among countries. The American Economic Review, 60(5), 895-911. [ Links ]
18. Hayami, Y., & Ruttan, V. W. (1971). Agricultural development: an international perspective. Baltimore: John Hopkins University Press. [ Links ]
19. Henningsen, A., Mpeta, D. F., Adem, A. S., Kuzilwa, J. A., & Czekaj, T. G. (2015). A meta-frontier approach for causal inference in productivity analysis: the effect of contract farming on sunflower productivity in Tanzania. Selected Paper prepared for presentation at the 2015 Annual Meeting of Agricultural and Applied Economics Association. Department of Agricultural, Environmental, and Development Economics, San Francisco, CA, July 26-28. Recuperado de http://eprints.lancs.ac.uk/89119/1/productivityPaper.pdf [ Links ]
20. Hernández, A. (2011). Complejo Lechero En Vassallo, M. (Ed.) Dinámica y competencia intrasectorial en el agro, Uruguay 2000-2010, (pp. 53-71). Montevideo, Uruguay: Facultad de Agronomía. [ Links ]
21. Jiang, N., & Sharp, B. (2015). Technical efficiency and technological gap of New Zealand dairy farms: a stochastic meta-frontier model. Journal of Productivity Analysis, 44(1), 39-49. [ Links ]
22. Jondrow, J., Konx Lovell, C. A., Materov, I. S., & Schmidt, P. (1982). On the estimation of technical inefficiency in the stochastic frontier production function model. Journal of Econometrics, 19(2), 233-238. [ Links ]
23. Kodde, D. A., & Palm, F. (1986). Wald criteria for jointly testing equality and inequality restrictions. Econometrica, 54(5), 1243-1248. [ Links ]
24. Kompas, T., & Che, T. N. (2006). Technology choice and efficiency on Australian dairy farms. Australian Journal of Agricultural and Resource Economics, 50(1), 65-83. [ Links ]
25. Kumbhakar, S. C., & Knox Lovell, C. A. (2000). Stochastic frontier analysis. Cambridge, UK: Cambridge University Press. [ Links ]
26. Kumbhakar, S. C., Line, G., & Hardker, J. B. (2012). Technical efficiency in competing panel data models: A study of Norwegian grain farming. Journal of Productivity Analysis, 41(2), 321-337. [ Links ]
27. Meeusen, W., & van den Broeck, J. (1977). Efficiency estimation from Cobb-Douglas production functions with composed error. International Economic Review, 18(2), 435-444. [ Links ]
28. Mondelli, M. P., Lanzilotta, B., Picasso, V., Ferreira, G., Vairo, M., & Cazulo, P. (2013). Encuesta de actividades de innovación agropecuaria (2007-2009). (ANII Colección de Indicadores y Estudios Nro. 8) Recuperado de http://www.cinve.org.uy/wp-content/uploads/2013/09/ENCUESTA_ACTIVIDADES_INNOVACION_AGROPECUARIA_2007_2009-1.pdf [ Links ]
29. Moreira, V. H., & Bravo-Ureta, B. E. (2010). Technical efficiency and metatechnology ratios for dairy farms in three southern cone countries: a stochastic meta-frontier model. Journal of Productivity Analysis, 33(1), 33-45. [ Links ]
30. O'Donnell, C. J., Prasada Rao, D. S., & Battese, G. E. (2008). Metafrontier frameworks for the study of firm-level efficiencies and technology ratios. Empirical Economics, 34(2), 231-255. [ Links ]
31. Rao, E. J. O., Brümmer, B., & Qaim, M. (2012). Farmer participation in supermarket channels, production technology, and efficiency: The case of vegetables in Kenya. American Journal of Agricultural Economics, 94(4), 891-912. [ Links ]
32. Villano, R., Bravo-Ureta, B., Solís, D., & Fleming, E. (2015). Modern rice technologies and productivity in the Philippines: disentangling technology from managerial gaps. Journal of Agricultural Economics, 66(1), 129-154. [ Links ]
© 2019 por los autores; licencia otorgada a la Revista Estudios Económicos. Este artículo es de acceso abierto y distribuido bajo los términos y condiciones de una licencia Atribución-No Comercial 3.0 Unported (CC BY-NC 3.0) de Creative Commons. Para ver una copia de esta licencia, visite http://creativecommons.org/licenses/by-nc/3.0/

