Inglês (pdf)
 Artigo em XML
 Referências do artigo
 Enviar este artigo por email
 Citado por SciELO
  Similares em
SciELO
Similares em
SciELO 
 Permalink
INTRODUCTION
Tourism is a source of employment, income, and regional development. Some economies have trusted for years in the development, promotion, and encouragement of this activity. While different types of tourism are emerging, and consumers are increasingly demanding personal experiences based on touristic resources instead of contemplating them, a new paradigm of possibilities of regional growth is arising. Natural, cultural, or built touristic resources and amenities are the key inputs in the tourism industry, and they could have an impact on income distribution and employment in tourism (Marcouiller, Kim & Deller, 2004; Porto & Espinola, 2019; Roback, 1988; 1982).
At the same time, several studies have argued that the tourism sector is mainly characterized by jobs that require relatively low levels of schooling, few skills, and exhibit unfavorable conditions such as higher levels of informality, short average tenure, and gender segregation (Ashworth, 1992; Lee & Kang, 1998; Delfim Santos & Varejão, 2007; Blake, Arbache, Sinclair & Teles, 2008; Muñoz-Bullón, 2009; Espinola, 2016; Porto & García, 2022; García & Porto, 2021). In this way, these activities related to tourism are characterized by lower relative wages as compared to the local economy’s average.
These features, through regional tourism development, might affect the average level of regional or local wages and income, and consequently, regional income distribution. Nevertheless, empirical evidence is ambiguous, and results from the literature are not conclusive. While some authors have shown that tourism development enhances income inequality, others found that tourism development contributes to regional economic convergence (Li, Chen, Li & Goh, 2016). An argument that links tourism development with income inequality is the concept of cultural and creative cities. Creative cities base their local development plan on cultural industries, and empirical studies have found that they are associated with higher levels of income inequalities (Florida, 2002; 2017; Donegan & Lowe, 2008). It implies that cultural amenities could be associated with greater levels of income inequality. Regarding natural amenities, it has been argued that they constitute an attraction for certain types of individuals that tends to increase incomes in the region, anchoring cities to high income over time and resulting in a persistent spatial distribution of income. In this way, the allocation and distribution of amenities in a country could generate regional disparities in income distribution due to tourism.
Uruguay is a small country of around 3.5 million inhabitants in a 175 thousand km2 area, where the tourism sector represented 3.1% of GDP in 2019 (INE, 2021) and 7.2% of total employment (Ministry of Tourism of Uruguay, 2019b). In 2018, visitors’ expenditures represented 18.8% of goods exports and 43.9% of services exports (Ministry of Tourism of Uruguay, 2019a). This share more than doubles the share of tourism on exports in the Latin American region, which makes Uruguay a tourism-specialized country.
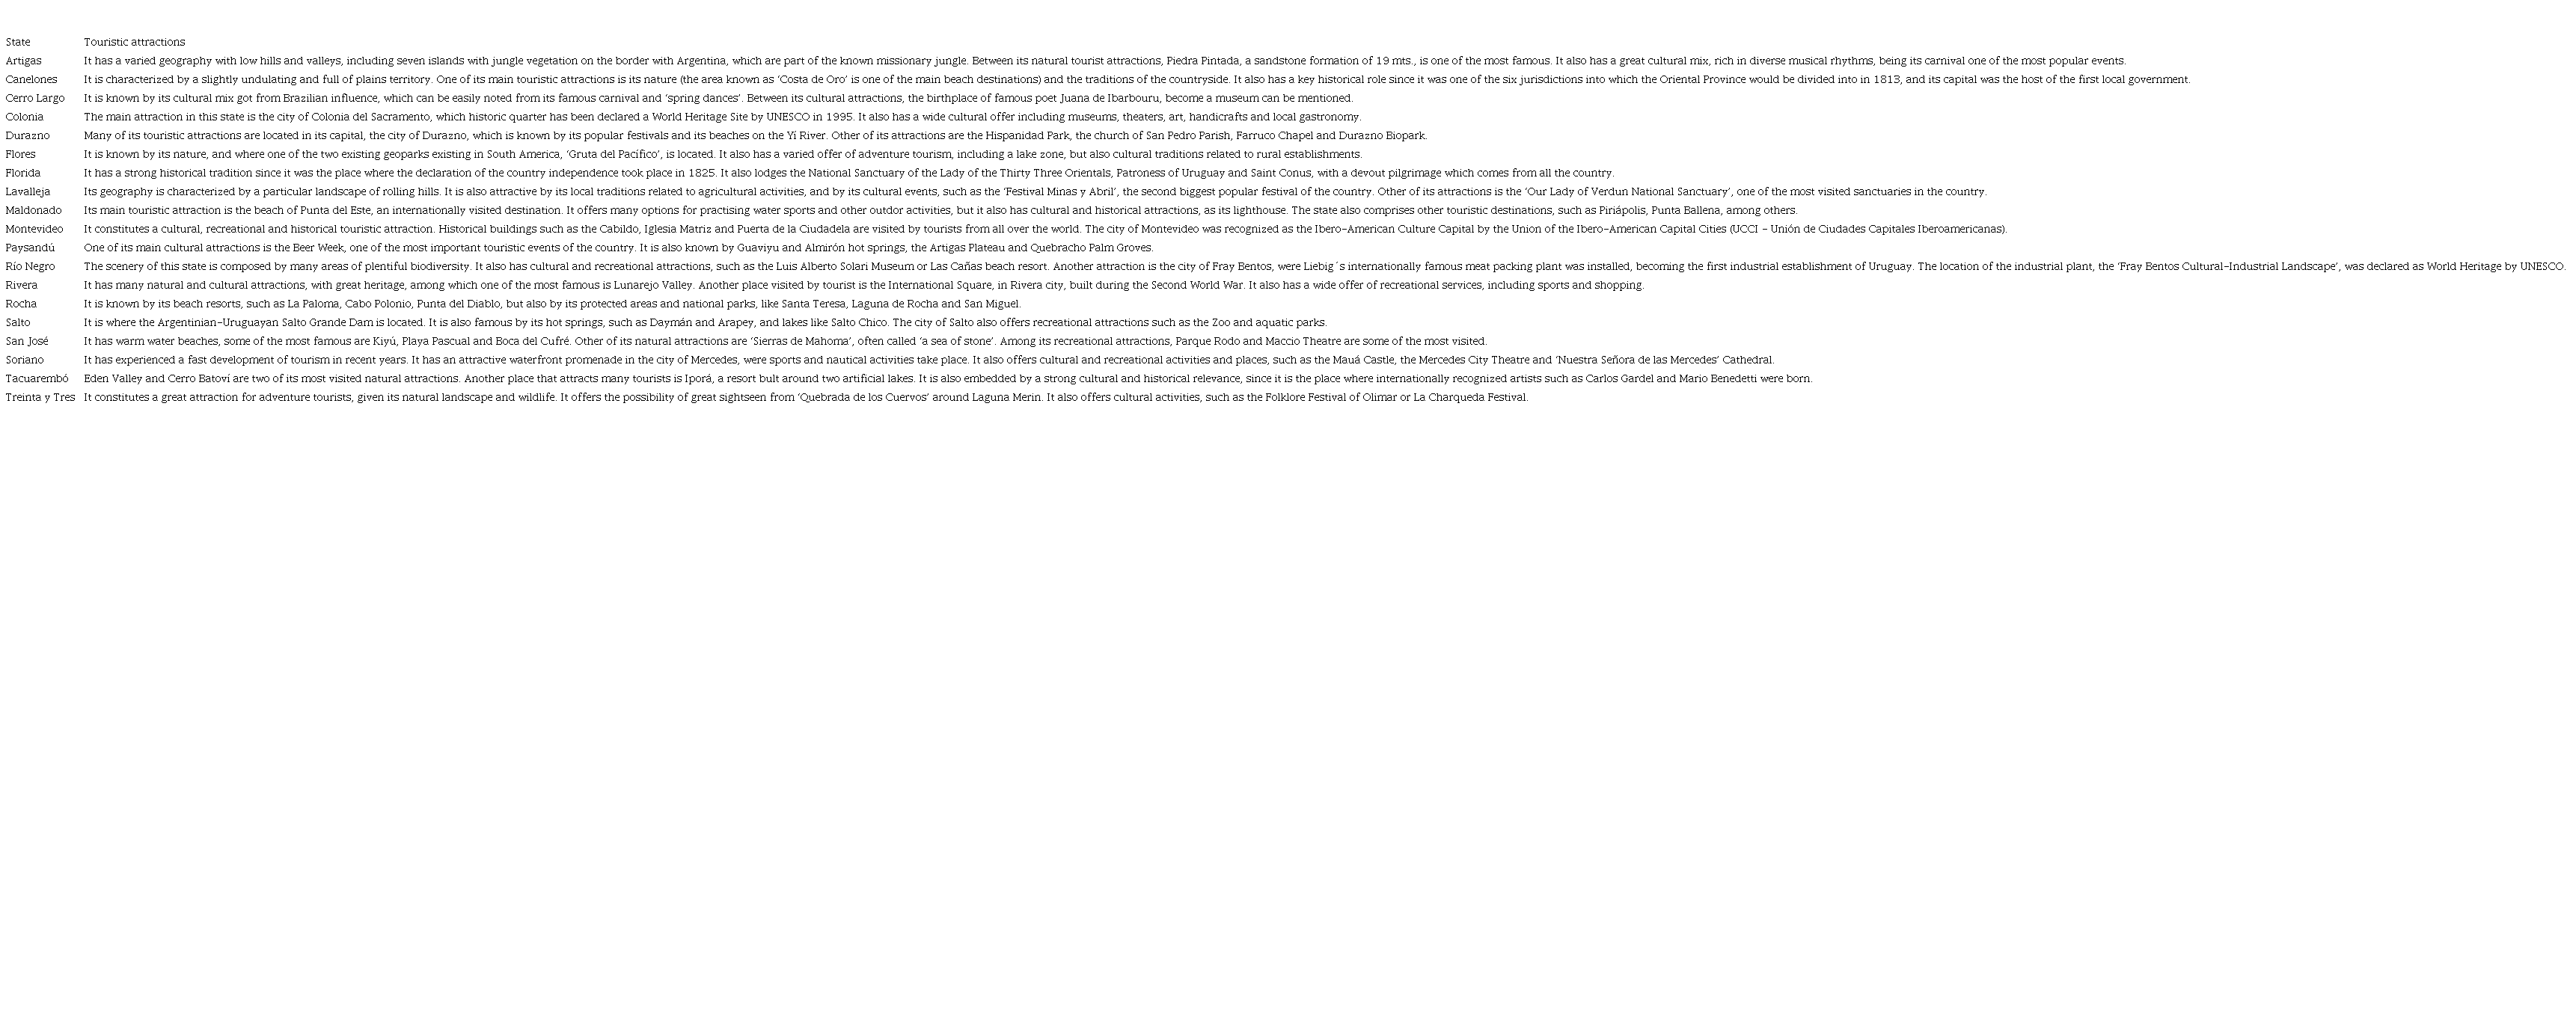
Although the country is mainly attractive for tourists due to its natural resources, the Metropolitan region (where Montevideo, the capital of the country, is situated) is mainly recognized as a recreational and cultural destination. The beach in Punta del Este is known as one of the main beach resorts in South America and offers great scenery for practicing water sports and outdoor activities. Other places, such as Colonia del Sacramento and Fray Bentos in the Littoral region, are also distinguished for their historical and cultural heritage, even recognized as World Cultural Heritage by UNESCO. In this way, the distribution of tourist amenities along the country exhibits some regional disparities.
Considering data from 2000 to 2019, nearly 24% of international tourists have traveled to Punta del Este city, the most famous sun destination, and more than 30% to Montevideo, the capital of the country. Regarding domestic tourism, these regions –East and Metropolitan– were also the main destinations in 2018, with a share of about 35% each (Ministry of Tourism, 2019a). It is not surprising then that tourism employment represents an important share of total employment in those regions. In 2019, the share of tourism jobs in total employment was 8.8% in the East and 7.4% in the Metropolitan region, above the shares in other regions and in the whole country (Ministry of Tourism, 2019c).
In this context, one relevant issue is how the employment and income generated by the tourism sector are distributed within the country. Is it distributed equally or is there a geographical concentration of tourism incomes? And what is the link between this distribution and the allocation of amenities? It is recognized that tourism, if managed well, can be an important channel through which sustainable development can be achieved, and knowing the reality of each region could help to face the challenges of the new era of tourism.
The aim of this study is to explore the relationship between regional inequalities and the development of tourism in Uruguay for the period 2006-2019. Following Porto and Espinola (2019), we build touristic amenities indices and estimate a spatial econometric model to account for this relationship.
The structure of the article is as follows. Section I presents a brief review of the literature. Section II includes a characterization of employment in tourism based on summary statistics of variables at the individual level and Section III describes the methodology to explore the relation between a departmental endowment of touristic amenities and income distribution in the tourism sector. Section IV presents the results and Section V concludes.
I. LITERATURE REVIEW
Literature has largely studied the regional distribution of tourism regarding income inequalities and, to a less extent, related to the endowment of the different types of touristic resources. Some studies show how the employment tourism sector features affect the average level of regional or local wages and income (Ashworth, 1992; Lee & Kang, 1998; Delfim Santos & Varejão, 2007; Blake et al., 2008; Muñoz-Bullón, 2009; Nyaruwata & Tendayi Nyaruwata, 2013; Espinola, 2016).
Alam and Paramati (2016), focusing on 49 developing economies around the world, found that tourism significantly increases income inequality. The reason may be the oligopolistic market structure since most tourism services providers are a few multinational corporations, which leads to greater inequalities. Göymen (2000) and Seckelmann (2002) also found that regional inequality in Turkey is increased by tourism since most investments and public policies are focused in that sector. Similarly, Carrascal Incera and Fernández (2015) showed that tourism consumption contributes to income inequality in some regions of Spain by benefiting high-income households more than low-income ones. Njoya and Seetaram (2018) affirmed that tourism in Kenya benefits the poor, but its impact is higher in urban than in rural areas. For the case of China, Zhao and Xia (2020) and Shi, Luo, Jin, Cheng and Li (2020) found that tourism reduces poverty in western provinces, but it has a negligible effect in eastern ones mainly due to the differential impact on poor households from rural areas. On the contrary, other authors supported the notion of a positive effect of tourism on income distribution (Lee & Kang, 1998 for South Korea, and Marcoullier & Xia, 2008 for the United States). Li et al. (2016) identified that the tourism development contributes to regional economic convergence in China, through a spatiotemporal model. Chi (2020) found that the long-run relationship between tourism revenue and income inequality can differ across developed and developing economies. Fang, Gozgor, Paramati and Wu (2020) investigated the effects of tourism indicators on income inequality for a sample of 102 countries, with annual data from 1995 to 2014. Using different techniques of estimation, they concluded that tourism indicators have a significant negative impact on income inequality in developing economies, while they have an insignificant impact in developed economies.
In addition, literature has focused on the role of a region’s endowment of amenities in income distribution. Both natural and built amenities directly affect tourism activities, thus having a strong impact on income generation of tourism (Marcouiller et al., 2004; Roback, 1988; 1982). However, there are different theories about the impact of touristic amenities on income distribution (Goe & Green, 2005; Kuentzel & Ramaswamy, 2005). Although amenities play a key role as inputs in the tourism industry, attracting visitors and encouraging touristic infrastructure investments, this might reinforce geographical inequalities, while the unfavorable conditions of jobs in this sector might lead to enlarged inequalities within a region.
Literature has also identified different effects on income distribution according to the type of amenities considered. Natural amenities are recognized as important growth determinants, favoring regions endowed with valuable natural resources. It has also been argued that natural amenities provide an attraction for highly educated, mobile, and dependent on technology individuals, which is more likely to be related to higher incomes (Marcouiller et al., 2004). Moreover, natural amenities –when they are persistent– are believed to anchor cities to high income over time and to exhibit a persistent spatial distribution of income (Lee & Lin, 2017). At the same time, the seasonal and low-skilled nature of these jobs might reinforce income inequalities.
The determinant role of natural amenities in income distribution was assessed by many empirical studies. Marcouiller et al. (2004) found that certain types of amenities in United States (mainly, water-based amenities) are associated with a more equal income distribution. The results of Lee and O’Leary (2008) based on nonmetropolitan counties of the United States, are that income inequality was positively related to benefits in the recreation and tourism industry; while English, Marcouiller and Cordell (2000) showed that recreation –and tourism– dependent counties have a higher average income, lower economic diversity, and higher household costs, as compared to other counties in the region. McGregor and Willis (2019) argued that natural amenities are strongly associated with local economic development. On the contrary, Gunderson and Ng (2005) found that the average per capita income in tourism-dependent counties is lower than in non-tourism-dependent counties.
Regarding built amenities, both historical and recreational constitute attractions for visitors, thus increasing demand for tourism services in the regions where they are placed and then contributing to their economic growth. But there is a wide literature that argues that certain types of cities, which base their local development plan on cultural industries, are associated with higher levels of income inequalities (Florida, 2002; 2017; Donegan & Lowe, 2008). Besides, these types of amenities tend to be concentrated in urban areas, reinforcing regional inequalities. It has also been pointed out that restaurant meals and non-durable entertainment amenities are mainly placed in downtown areas of major cities (Couture & Handbury, 2017), which attracts higher-income households, increasing house prices in those areas and then making the poor worse off (Couture, Gaubert, Handbury & Hurst, 2020). However, some types of museums and heritage sites are often spread over many rural and non-metropolitan areas (Bertacchini, Nuccio & Durio 2021). Many studies have recognized the role of proximity tourism –that is, leisure and entertainment activities within home regions, involving nearby destinations and short distances (Jeuring & Diaz-Soria, 2017)– in reducing the gap between urban and peripherical areas (Salvatore, Chiodo & Fantini, 2018), Consequently, the placement of museums, heritage and historical sites in peripherical areas could offset the inequalities generated by other types of amenities. Also, certain type of visitors has a special interest in exploring rural villages with historical heritage (Royo-Vela, 2009), hence the impact of cultural amenities on regional inequality might be ambiguous.
Porto and Espinola (2019) is the only study that explores the relationship between tourism employment, income distribution and endowment of amenities for a country in Latin America. Using data of 29 urban agglomerates in Argentina during the period 2004-2015, they examine the impact of touristic amenities in wages inequality. Results suggest that labor income distribution depends on the natural resources endowment, as well as the development of tourism in the agglomerates.
II. DATA
II.1 Tourism employment and tourism development in Uruguay
We use data from the Continuous Household Survey (Encuesta Continua de Hogares, ECH, Spanish acronym) conducted by the National Institute of Statistics of Uruguay. It has national coverage since 2006, thus allowing for the spatial analysis to cover both urban and rural departments until year 20191.
We define the sensitive tourism employment as that of any establishment whose primary economic activity is any of the following: 1) accommodation services, 2) restaurants, 3) travel agencies and complementary touristic support services, and 4) entertainment, cultural and sport services2,3. This definition has been common in literature (Espinola, 2016; Porto & Espinola, 2019; United Nations & UNWTO, 2010). Also, alternative definitions of tourism activities were tested and the results did not change much.
The tourism sector accounts for around 5.6% of total employment4 while non-tourism services’ employment represents 57.3% (Table 1). Regarding socio-economic characteristics, the share of women on total workers is significantly lower in tourism sector as compared with the non-tourism sector, and workers in tourism sector are on average younger (more than two years of difference). Also, they have fewer years of formal education (the difference is close to a year) and almost half of workers in the sector (49.3%) have secondary incomplete as their maximum educational level achieved. In the non-tourism sector this share is about 39%, with more than 18.4% of workers with superior complete (6.2% in the tourism sector). The results are in line with international evidence (Delfim Santos & Varejão, 2007, for Portugal; Muñoz-Bullón, 2009, for Spain; and Espinola, 2016, for Argentina).
Regarding labor conditions, tourism sector also shows a more disadvantaged environment than the non-tourism one, since it exhibits significantly higher informality rates5 and it is more concentrated in small and mid-sized firms. If we consider occupational qualification, the results are consistent with those related to education (more than 76.8% of workers in tourism perform tasks as operators or unskilled workers versus 68.8% in the non-tourism sector)6. The tourism sector shows the lower monthly income and hourly wages, compared to the rest of the sectors and the economy as a whole.
Table 1. Main labor and socio-economic characteristics of employees, by employment sector, 2006-2019
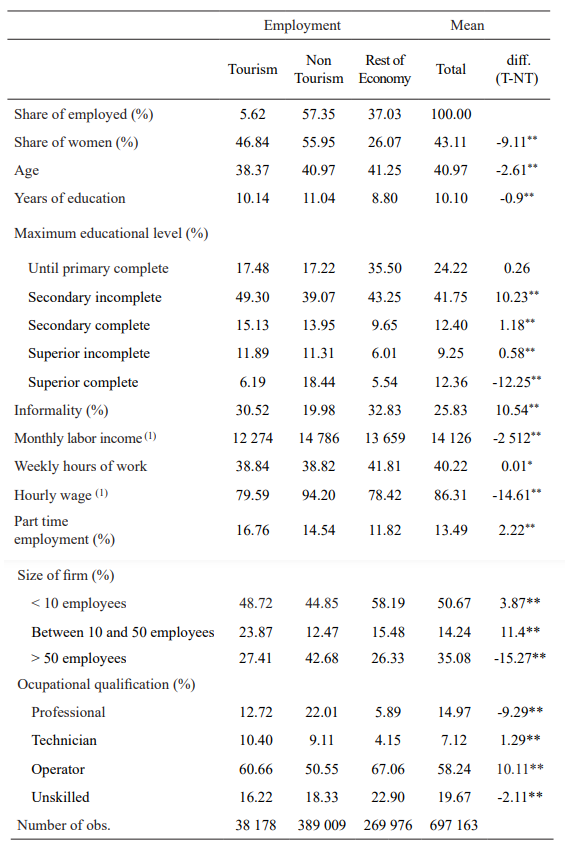
*Significant at 5%;
**significant at 1%
Source: Own calculations based on SEDLAC (CEDLAS and the World Bank) and ECH, 2006-2019.
A brief regional characterization of Uruguay is presented in Table 2 and Figure 1. Uruguay is divided into 19 states (‘departamentos’) with different characteristics. Population density is over 2600 inhabitants/km2 in Montevideo while it is about 20 inhabitants/km2 for the whole country. Regarding social welfare, Montevideo has the lowest share of the population (less than 27%) with at least one unsatisfied basic need (UBN) (Table 2).
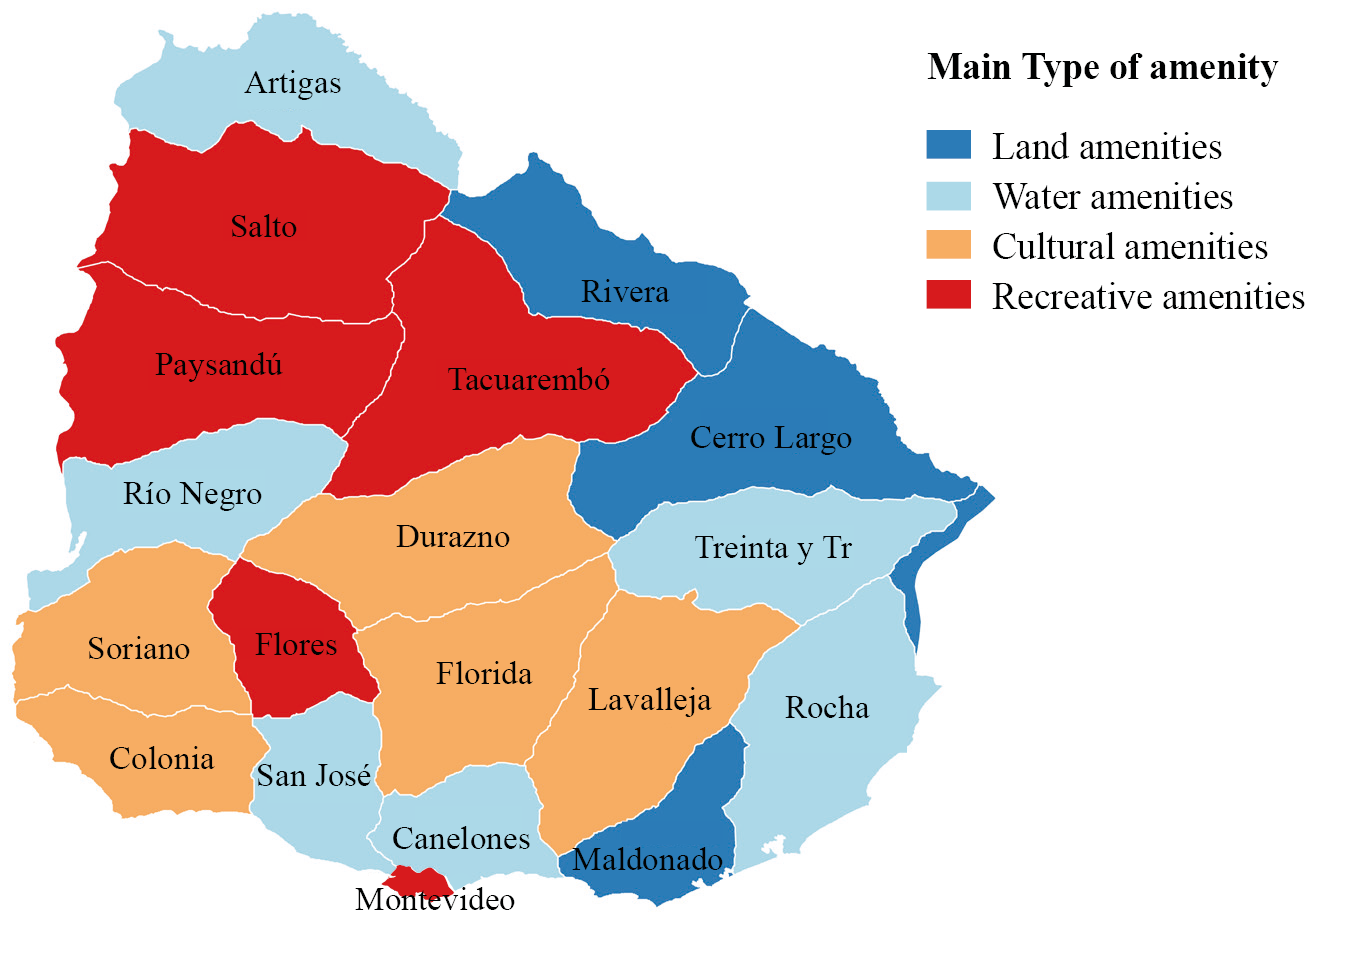
Figure 1 describes the regional endowment of amenities and the main touristic attractions type in each department7, which define the regional tourism development of Uruguay. Amenities are a key input for tourism production, generation of employment, and income. Following Porto and Espinola (2019) and based on specialized literature (Deller, Tsai, Marcouiller & English, 2001; English et al., 2000; Marcouiller et al., 2004), we developed four indices of touristic amenities for each department: land-based natural amenities, water-based natural amenities, cultural-historical amenities, and recreational amenities. These indices were computed as an arithmetic average of a set of standardized variables in each category. These variables were built from a comprehensive search of data in national, regional and local sources, both governmental –such as the National Institute of Statistics, Ministry of Tourism, Ministry of Agriculture, Livestock and Fishing, Ministry of Culture and Education, Ministry of Environment, Uruguayan Institute of Meteorology, among others– and non-governmental ones –Uruguayan Football Association and touristic and local websites such as “Portales del Uruguay”, “WelcomeUruguay.com”, “Montevideo Portal”, among others–. A detailed description of how indices were computed can be found in Porto and Espinola (2019).
A region constituted by Salto, Paysandú and Tacuarembó is mainly characterized by having recreational amenities, as well as Flores and Montevideo. We can also perceive a cultural region in the area of Durazno, Florida and Lavalleja, and also in Soriano and Colonia. Water-based amenities are mainly concentrated in Southern Interior region, while land-based ones are the main attributes in North-east states.
Table 2. Characterization of states in Uruguay. Main indicators

(*)2020 projects.
(**)Percentage of population with at least one unsatisfied basic need (UBN), extracted from Calvo (coord, 2013).
Source: Own elaboration based on INE-Anuario Estadístico Nacional 2021, 98ª versión and Calvo (coord, 2013).
II.2 Spatial analysis of tourism development, tourism employment and income distribution
In this section we perform a descriptive analysis in order to deep about data and the regional distribution of income and touristic resources. The Gini index measures the inequality among values of a frequency distribution (as the levels of income) and it is based on the comparison of cumulative proportions of the population against cumulative proportions of income they receive, and it ranges between 0 (perfect equality) and 1 (perfect inequality)8.
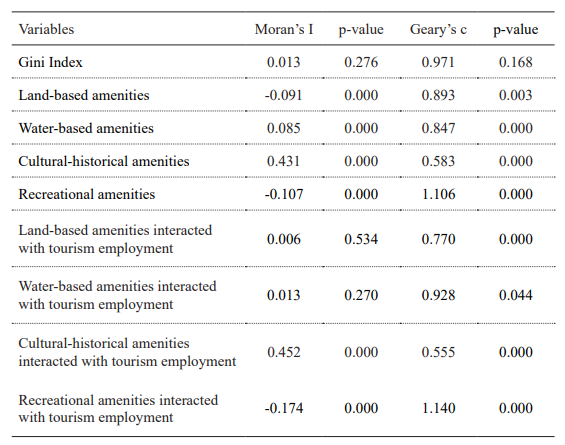
Table 3 reports Moran’s Index for the Gini coefficient and the touristic amenities indices in order to perform an Exploratory Spatial Data Analysis (ESDA). Moran’s Index evaluates spatial autocorrelation based on both feature locations and feature values, simultaneously. Given a set of features and an associated attribute, it evaluates whether the pattern expressed is clustered, dispersed, or random. If the index takes positive values, it implies positive spatial autocorrelation, since each observation value and their neighboring values are similar. On the opposite, if it takes a negative value, it implies negative spatial autocorrelation. Results show that, for the Gini Index, the null hypothesis of the Moran’s Index cannot be rejected: there is no spatial autocorrelation in income inequality. The index also suggests spatial autocorrelation in the endowment of amenities. For water-based and cultural-historical amenities, the association is positive –meaning that if a geographical unit has a high level and distribution of this type of amenities, its neighbors will also have a high level and distribution of them– while for land-based and recreational amenities the autocorrelation is negative, meaning that if a department has a high level and distribution of this attribute, its neighbors will have a low level of it. We also consider, as an accurate measure of tourism development, the interaction of each type of amenity with the share of tourism employment, in order to capture the relationship between amenities as inputs in the production and employment generated by tourism9. In this case, there is no evidence of spatial autocorrelation for the case of natural (land and water-based) amenities. Instead, cultural-historical and recreational amenities appear to be spatially autocorrelated. In the former case, the link is positive, while in the latter it is negative.
The table also reports Geary’s Contrast. This index lies between 0 and some unspecified value greater than 1. Values significantly lower than 1 demonstrate increasing positive spatial autocorrelation, whilst values significantly higher than 1 illustrate increasing negative spatial autocorrelation. Moran’s I is a measure of global spatial autocorrelation, while Geary’s C is more sensitive to local spatial autocorrelation. The conclusions arrived at with this index are generally the same as those revealed by Moran’s I.
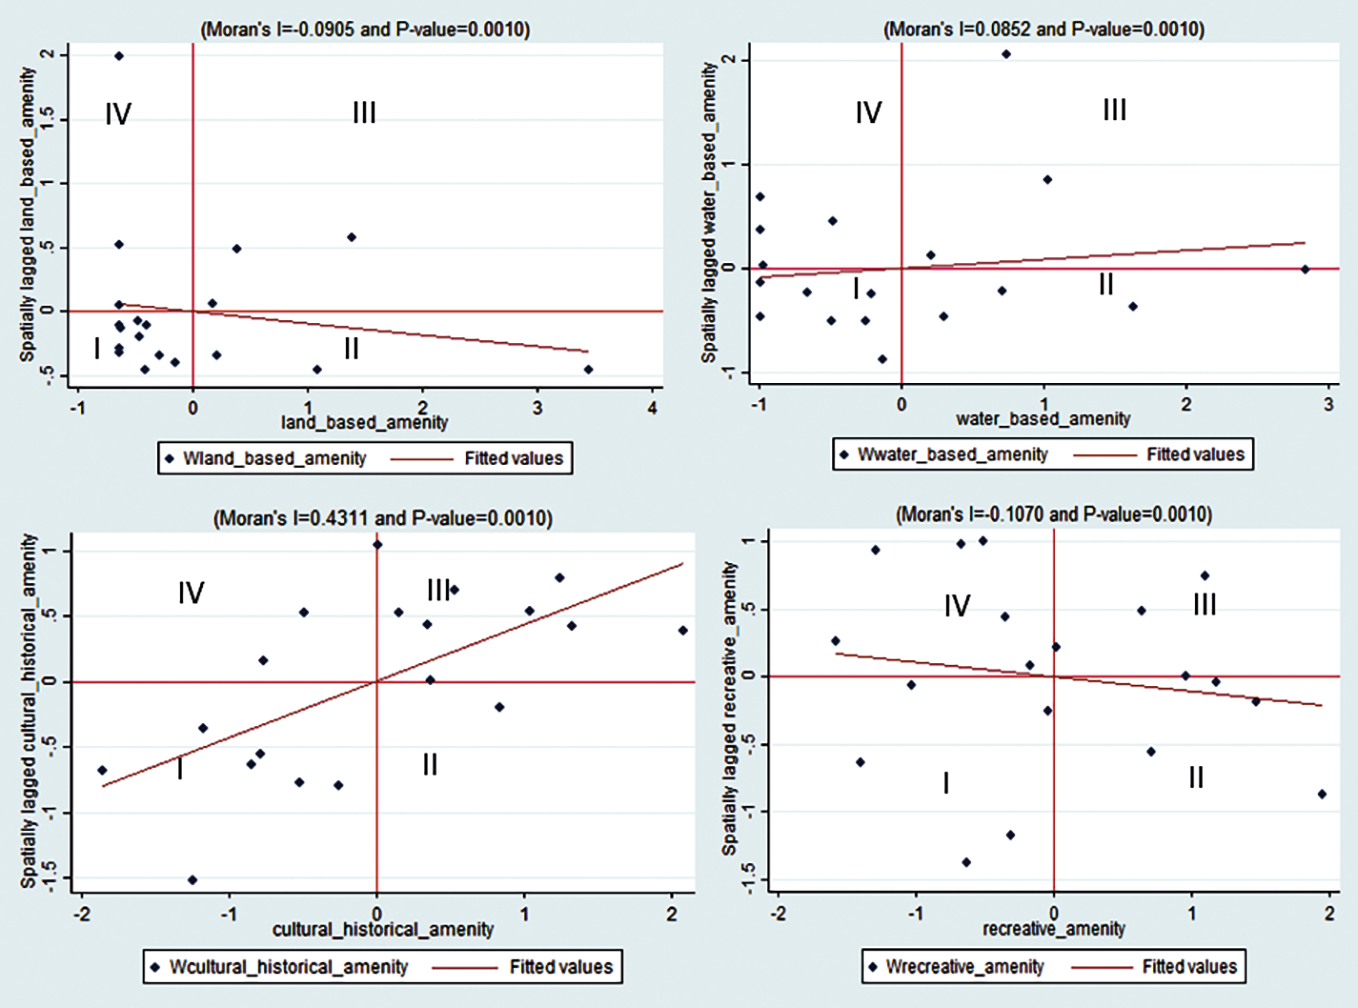
The pattern of regional distribution of touristic amenities can also be observed in Figure 2, which shows Moran scatter plot (Anselin, 1995) for amenities. This plot is based in Moran’s Index and the degree of linear association between the value of a variable x in the spatial unit i and the spatially weighted mean of the neighboring values of variable x, Wx (or spatial lag) (Anselin & Bera, 1998). The Moran scatter plot can be divided into four quadrants to indicate different types of spatial association. Quadrants I and III represent positive spatial association because low-low and high-high values are associated, respectively. Quadrants II and IV indicate negative spatial association because high-low and low-high values are associated, respectively.
These estimates support the hypothesis that the amenities are not randomly located, but they could present a spatial association, suggesting that the use of a SEM may be accurate. As mentioned above, in the model it was decided to use the interaction between amenities and tourism employment as a proxy for development in tourism as a variable of interest. As can be seen in Table 3, the spatial autocorrelation, in general, is maintained for the interacting variables.
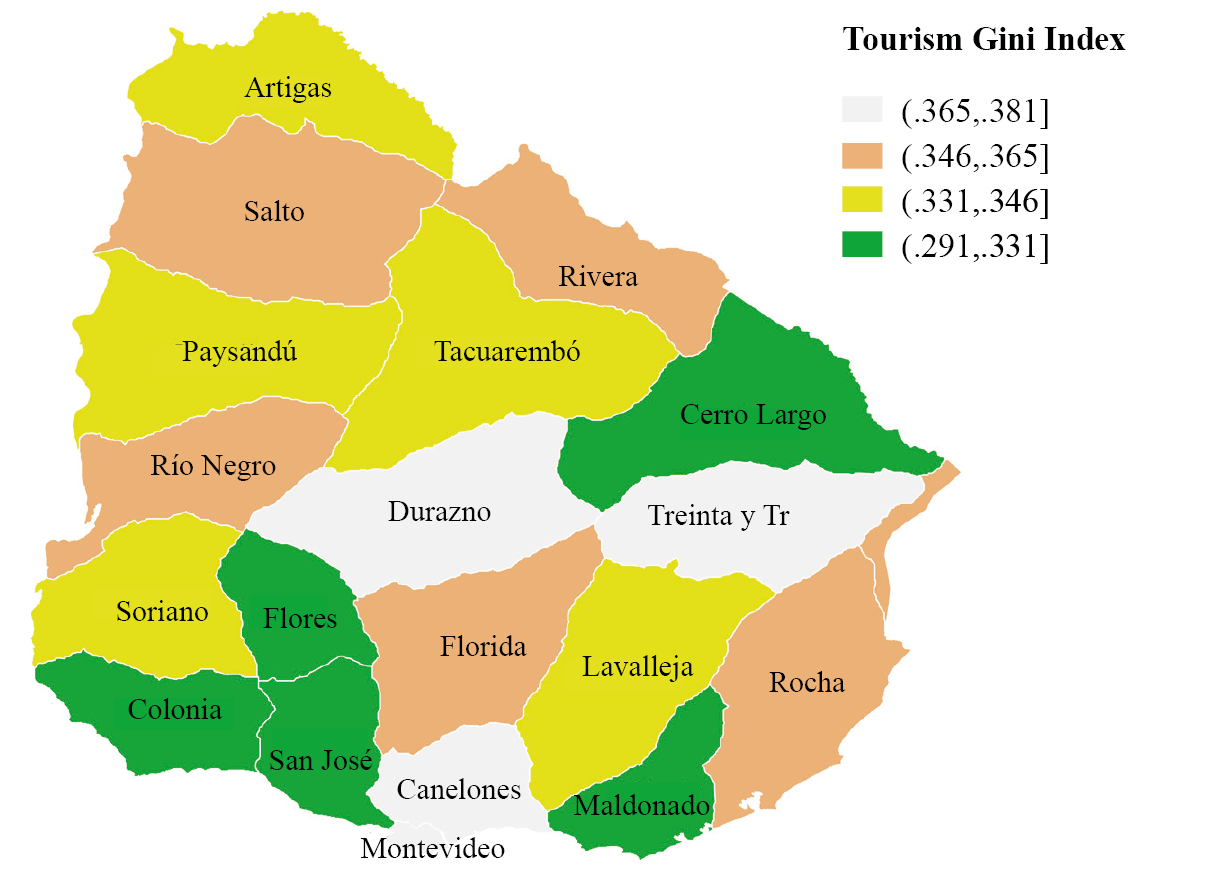
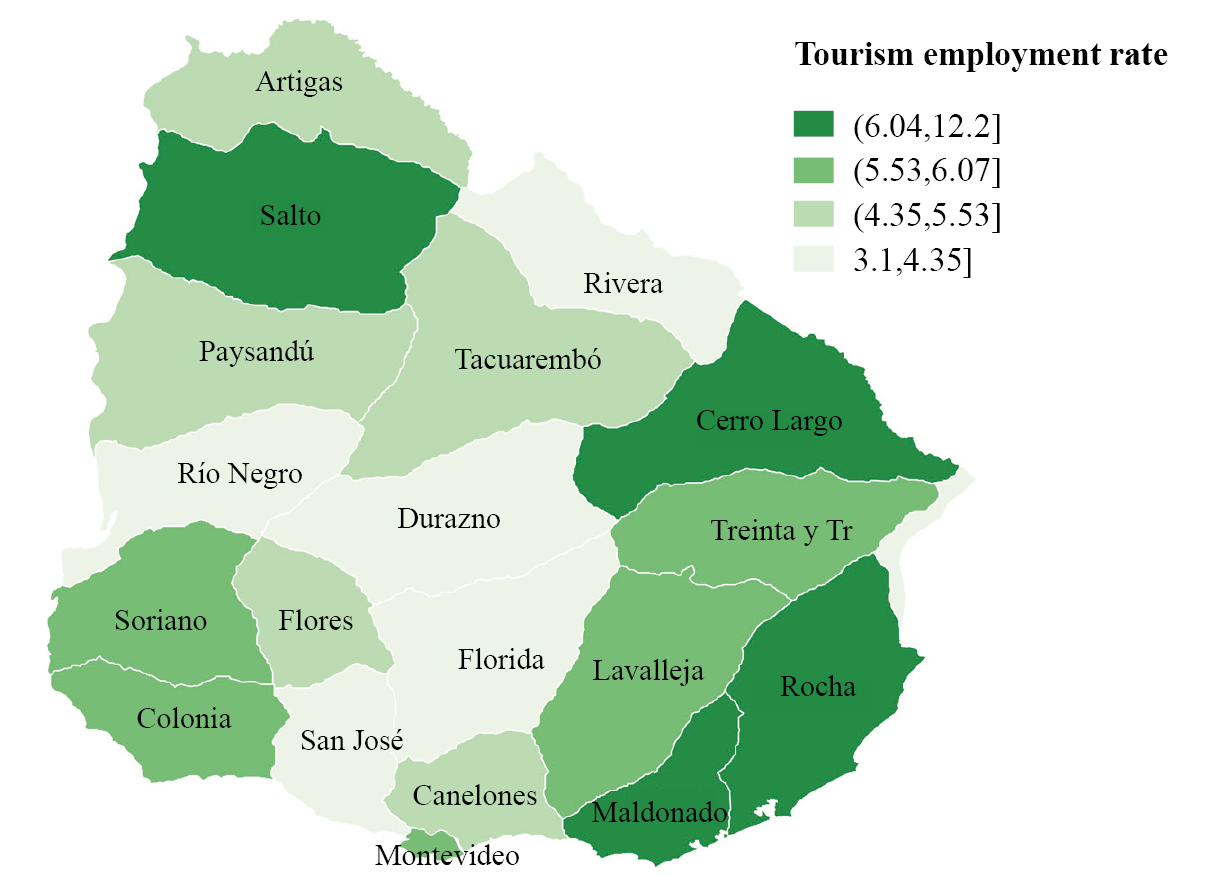
The geographical pattern of income distribution, employment rates in tourism and the main type of touristic resources are presented in the Appendix (Figures A1 and A2, respectively). Although there are not clearly delimited regions with high or low values of income inequality, the area formed by Colonia, Flores and San José exhibit lower levels of income inequality as compared with the rest of the country. Also, Maldonado, where the main sun destination is located (Punta del Este), shows lesser inequality levels than other departments. On the opposite, departments in the interior regions (Durazno, Treinta y Tres, and Canelones) exhibit the highest levels of income inequality in Uruguay (Figure A1). Regarding tourism employment rates (Figure A2), a slightly clearer pattern can be distinguished. Southern-east departments such as Maldonado, Rocha, Cerro Largo, Lavalleja and Treinta y Tres hold the higher employment rates.
III. METHODOLOGY
We estimate a spatial error model (SEM) to explain the relationship between regional inequality and tourism development. The equation to estimate is as follows:
 (1)
(1)
With
 (2)
(2)
The dependent variable is Giniit
, which resumes labor income inequality measured by Gini index in department i in period t, where i is one of the 19 departments that compose Uruguay, and t represents a year in the period 2006-2019. Matrix
The independent variables used in the model arise from the microeconomic theory of labor supply (Ashenfelter & Card, 2010; Mincer, 1970; Topel, 1994). The wages depend on the labor and personal conditions of the workers, and consequently, they could affect the labor inequality between and within the geographical areas. Each independent variable is expressed as the employed population share in each agglomerate.
The SEM allows for the possible spatial autocorrelation in the error term (Kim, Marcoullier & Deller, 2005; Marcouiller et al., 2004). This is represented by equation (2), where
The model is estimated through a fixed effects specification for panel data, since it involves a small number of groups corresponding to the 19 departments of Uruguay.
IV. RESULTS
Table 4 reports the estimation of the SEM. For the analysis of the relationship between regional tourism development and income inequality, two types of variables are introduced into the model: the share of tourism-based employment in total employment in each department (column 1), and the interaction between tourism amenities and tourism employment (columns 2 to 5 for the interaction term for each type of amenity separately, and column 6 for the inclusion of all the interactions terms). These interaction terms capture the effect of amenities-based tourism development.
Table 4. Estimation of the spatial error model
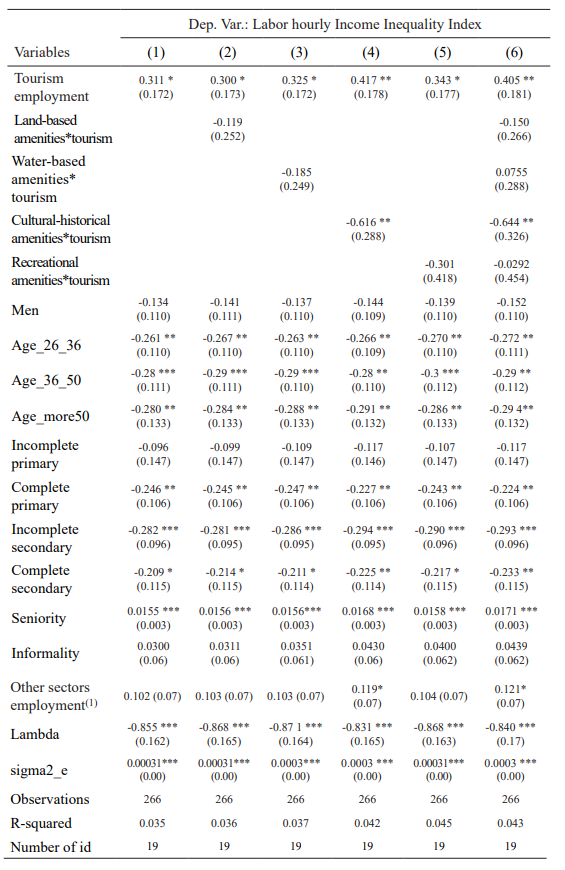
Standard errors in parentheses. *** p<0.01, ** p<0.05, * p<0.1
(1)It includes retail, industry and construction employment.
Source: Own elaboration.
The model of spatial autoregressive coefficient (lambda) is statistically significant showing that there is empirical evidence of the presence of spatial autocorrelation in the error terms. However, it has a negative sign, meaning that the residues of a department tend to be surrounded by neighbors with quite different residues. In the theoretical literature, there are some explanations for the presence of negative spatial autocorrelation. One of them is Myrdal’s backwash effect (Myrdal, 1957), which implies that growth in one region is harmful to growth in neighbor regions since it may attract resources and skilled labor from neighbor regions and reduce their growth potential (Kao & Bera, 2016). A similar counterintuitive result was also found by Porto and Espinola (2019) for the case of Argentina. Other possible methodological explanations for this might be the diverse patterns of spatial autocorrelation in the different types of amenities observed in the ESDA (different spatial autocorrelation patterns depending on the amenities), or the existence of aggregation errors in the elaboration of amenities variables collected at the department level.
The results show that tourism has an unequal effect on labor incomes: the estimated coefficient is positive and statistically significant. As was previously discussed, this positive association may be related to the fact that jobs in tourism sector tend to be characterized by more unfavorable conditions. It also implies that the hypothesis of a “Kuznets curve” associated to tourism (Ghosh & Mitra, 2021), that is, that higher levels of employment in tourism are linked to lower levels of income inequality is not supported here.
If we consider the interaction between amenities and tourism employment, the model suggests that departments with cultural-historical amenities tend to have a more equalitarian distribution of labor hourly incomes at a 5% confidence level. On the contrary, there is no evidence of a relationship between other types of amenities and income inequality. In the data analysis, we observe that departments like Soriano and Colonia –both with cultural-historical amenities– have a high Gini Index and high tourism employment share.
The determinants traditionally used to explain wage inequality from the supply side have the expected signs. According to the theory of gender inequality, the participation of men in the labor market has a negative relationship with wage inequality, although in this case, it is statistically not significant. Regarding workers’ age, results suggest that, in general, when the share of elder workers is higher, income distribution is more equalitarian. Conversely, seniority is associated with higher levels of inequality. A positive relationship between some education levels and income inequality is also observed: an increase in education levels may demonstrate an equalizing factor in regional labor income distribution. The effect is statistically significant for the secondary degree (complete and incomplete) and complete primary degree (as compared with those who have a university education). Higher inequality is also related to the share of informal, although the estimates are not statistically significant.
DISCUSSION AND CONCLUDING REMARKS
In recent decades, tourism has become an important industry for most regional economies. It is known for its contribution to employment, income, and regional development. In Uruguay, the tourism sector represented 3.1% of GDP and 7.2% of total employment in 2019 (INE, 2021; Ministry of Tourism of Uruguay, 2019b). In addition, amenities are a key input for tourism production, generation of employment, and income. However, the relationship between tourism, amenities and inequality is not theoretically or empirically clearly defined. The present study is a first step to the study and exploration of regional inequalities and its relationship with the development of tourism and amenities endowment for the case of Uruguay.
The purpose of the study is to know and make visible the distributional impact of the tourism sector, mainly within the countries, in order to provide information to focus public policies from an equality perspective in the field of tourism. The relationship between regional inequalities and the development of tourism and amenities endowment was explored through a spatial economic analysis using a data panel at the department level for the years 2006-2019, using data from the Encuesta Continua de Hogares of Uruguay. For amenities endowment, we built four indices of touristic amenities (water, land, cultural-historical and recreative).
We found that differences in labor conditions exist between tourism and non-tourism sector and the spatial analysis suggested a possible association between income distribution and tourism employment in association with the endowments of touristic amenities in each region. Thus, the study’s main finding is that a positive relationship between tourism sector and regional inequalities exists. The departments with the highest employment in tourism tend to have more unequal incomes than those departments with the least employment in tourism. This result is in line with the results obtained in other international studies (Nguyen, Schinckus, Su & Chong, 2021; Fang et al., 2020; Porto & Espinola, 2019).
The unequal distribution of income could be related, in part, to the negative characteristics of the pool of workers in the tourism sector, with low salaries, and precarious working conditions summarized in informality, as shown in Table 1 and evidenced by several studies (García, 2020; Porto & Espinola, 2019; Porto & García, 2022; Espinola, 2016; Delfim Santos & Varejão, 2007; Muñoz-Bullón, 2009). In this sense, the Latin America region is experiencing a wave of promotion policies on employment seeking for mitigating effects and focusing on the development of quality of employment, innovative competencies, and smart initiatives. Several training programs on digital technologies have been implemented in Brasil, Chile, Colombia, and Costa Rica, including safety and hygiene in accommodation, digital marketing, web positioning, the development of technical careers such as Tourist Guidance, Community Recreation Technician, Camping Services Assistant and Ecotourism related training courses (Quicaña, 2021).
The key role of natural amenities in income distribution was also remarked on by previous studies (English et al., 2000; Lee & O’Leary, 2008; Marcouiller et al., 2004; Reeder & Brown, 2005). Besides, in relation to the amenities endowments, income regional inequality is lower in departments with cultural-historical amenities but not with natural amenities. These results contrast with those documented by Porto and Espinola (2019) for Argentina, where the natural amenities were statistically significant.
The negative association between cultural-historical amenities and income inequality should be taking into account in policymaking. Even though historical heritage cannot be reproduced, entertainment and cultural services can be developed. And, although we have not assessed causality, the results found might justify some efforts to promote developments in that direction, and infrastructure in those regions with an inequal income distribution as an attempt to improve it.
Regarding natural amenities, promoting rural tourism and nature tourism could be a way to move in the direction of a more equalitarian distribution of income, although nowadays there is no clear relationship in the case of Uruguay. Rural tourism has been one of the key elements of neoliberal social policies (Osorio González, Echeverría Cachipuendo & Thomé Ortiz, 2022). In Mexico, for instance, in recent years the national government has promoted rural tourism initiatives that directly or indirectly have impacted the use of land, valuing the cultural expressions of rural communities and indigenous peoples that have not previously worked in, nor for, the tourist activity. These initiatives include both the funding of specific entrepreneurship that take advantage of local attractions in the form of adventure or nature products and also the centralized funding from the federal government in the so-called “Magical Towns Program” (‘Programa Pueblos Mágicos’), targeted to small populations, which have sets of tourist attractions and that are intended to operate in a community manner (Osorio González, Echeverría Cachipuendo & Thomé Ortiz, 2022). This is also related to the community tourism concept, which emphasizes the role of local communities and territories as key elements of a model of tourism focused on cultural and natural endowments10. At the same time, natural tourism involves recreational activities in contact with nature with a conscious commitment to care for the environment. It has been particularly developed in Ecuador, but also in México, Dominican Republic and other Latin American countries. In Argentina, for instance, the Natural Route (‘La Ruta Natural’) is an example of a promotion and development program of nature tourism, with the explicit aim of promoting lesser-known circuits and destinations, articulating consolidated destinations with emerging destinations in integrated circuits, and improving the territorial and seasonal distribution of tourist activity. These experiences can serve as examples of policies applicable to Uruguay.
The study provides empirical evidence to existing literature regarding tourism employment and income distribution through a novel methodology that has been rarely applied in Latin American countries. Moreover, it constitutes the first study of tourism income distribution and the role of amenities in the case of Uruguay. It is important to highlight that the study uses the definition of tourism development from a supply approach; this is because the amenities are tourism supply variables, and to be consistent, the proxy variable that we consider is the employment in tourism. However, it is recognized that this approach may have some limitations. For example, the definition of tourism employment, which can be very broad and sometimes encompass sectors that generate tourism but also non-tourism employment. However, we use the traditional definition following the literature and the recommendations of the World Tourism Organization. (Espinola, 2016; Porto & Espinola, 2019; Muñoz-Bullon, 2009; United Nations & UNWTO, 2010). Additionally, we did different tests with changes in the definition of employment in tourism (excluding transportation, only with hotels and restaurants, etc.) and the results did not show significant changes. Complementarily, one interesting possibility is to consider an alternative indicator of tourism development from a demand approach, taking into account the regional distribution of touristic receipts or arrivals along the territory. It could also be thought of as a proxy for amenities understanding that tourism is attracted to zones where touristic resources are important. It might be likely that departments with a higher share of tourism tend to have higher levels of income, yielding a higher inequality between regions. However, the information is not available. The next research agenda considers incorporating this type of indicator into estimations. Another extension of the study will be to analyze the possibility of improving amenity rates, adding more variables to detect the particularities of each department.
ic resources are important. It might be likely that departments with a higher share of tourism tend to have higher levels of income, yielding a higher inequality between regions. However, the information is not available. The next research agenda considers incorporating this type of indicator into estimations. Another extension of the study will be to analyze the possibility of improving amenity rates, adding more variables to detect the particularities of each department.